The Singapore Department of Statistics (SingStat) publishes the Consumer Price Index (CPI) each month. The latest figures cover September 2026 and were released on 23 October 2026.
The Monetary Authority of Singapore (MAS) and the Ministry of Energy, Trade and Industry issued a joint statement the same day.
Inflation at a glance
- CPI-All Items: prices were 2.2% higher in September 2026 than a year earlier, down from 2.3% in August.
- MAS core inflation: 2.0% in September, down from 2.2% in August. It leaves out accommodation and private transport.
- This year so far: prices from January to September 2026 averaged 1.9% above the same months of 2025.
- Forecast: MAS expects CPI-All Items inflation of around 2.0% for 2026 and core inflation of 1.5% to 2.0%.
- Pay: an increment below 2.2% over the past year buys less than before.
- Next release: October 2026 figures on 23 November 2026.
What is the inflation rate in Singapore now?
CPI-All Items inflation was 2.2% in September 2026 and MAS core inflation was 2.0%, year-on-year. Both rates eased slightly from August, after climbing from 1.4% and 1.0% in January 2026.
| Measure | September 2025 | August 2026 | September 2026 |
|---|---|---|---|
| CPI-All Items | 0.7% | 2.3% | 2.2% |
| MAS core inflation | 0.4% | 2.2% | 2.0% |
- On a month-on-month basis, CPI-All Items rose 0.2% in September and core prices rose 0.1%.
- MAS said core inflation eased because services and retail goods rose more slowly. Slower private transport inflation also lowered the headline rate.
SingStat also publishes two measures that leave out some housing costs. In September 2026:
- CPI-All Items less imputed rentals for housing rose 2.6%. It leaves out the rent homeowners are assumed to pay themselves.
- CPI-All Items less accommodation rose 2.7%. It leaves out all housing rents and maintenance.
Inflation over the past 12 months
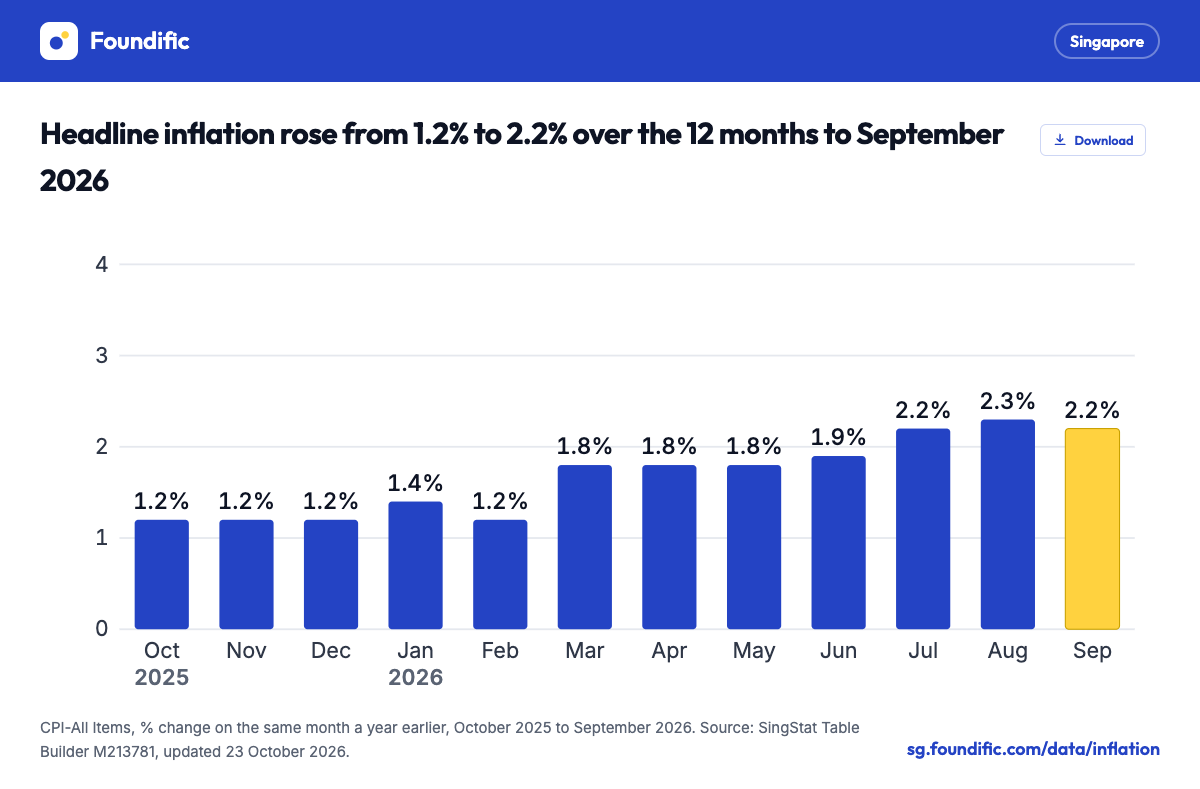
Inflation picked up from March 2026 and again from July.
- MAS core inflation was 1.0% in January 2026 and 2.2% in August.
- It rose from 1.5% in Q2 2026 to an average of 2.1% in July and August.
- MAS linked the rise to higher import costs reaching more goods and services.
- The regulated electricity tariff rose in Q3 2026, after a spike in global energy prices from April to mid-June 2026.
- From January to September 2026, core prices averaged 1.7% above the same months of 2025.
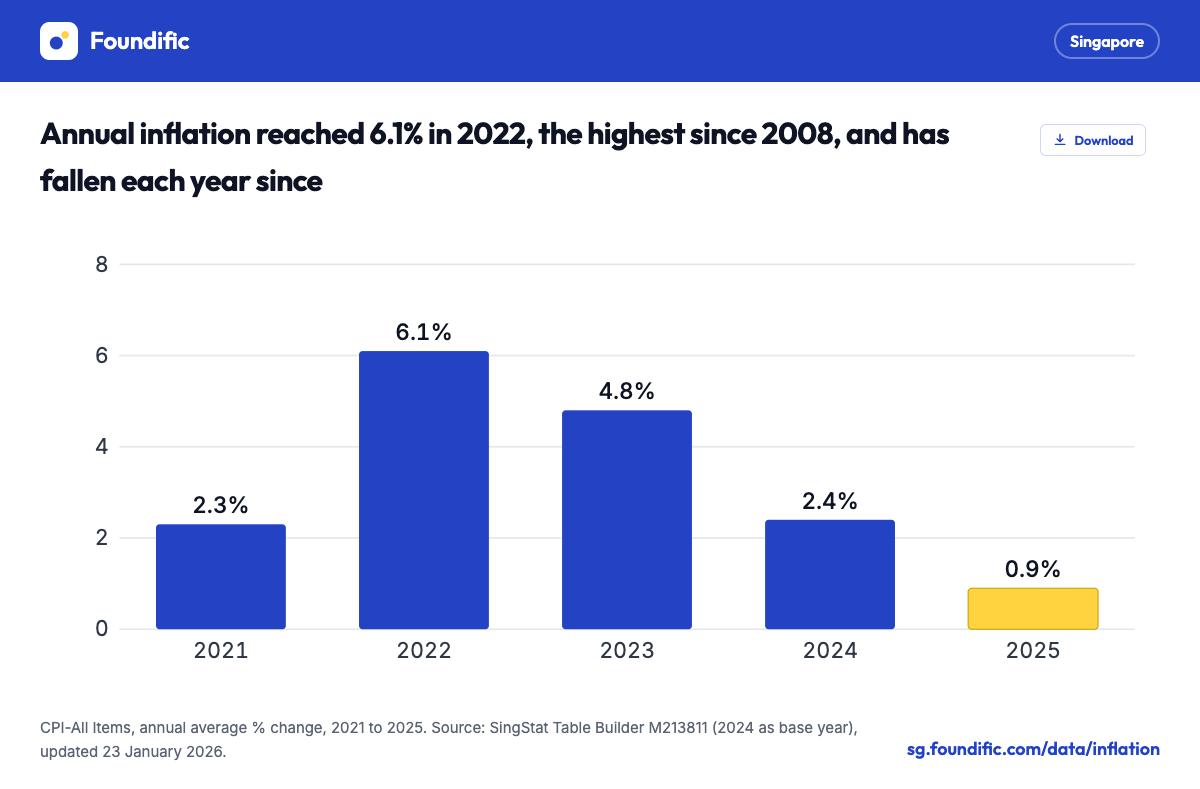
Inflation each year since 2015
| Year | CPI-All Items | MAS core inflation |
|---|---|---|
| 2015 | -0.5% | 0.5% |
| 2016 | -0.5% | 0.9% |
| 2017 | 0.6% | 1.5% |
| 2018 | 0.4% | 1.7% |
| 2019 | 0.6% | 1.0% |
| 2020 | -0.2% | -0.2% |
| 2021 | 2.3% | 0.9% |
| 2022 | 6.1% | 4.1% |
| 2023 | 4.8% | 4.2% |
| 2024 | 2.4% | 2.8% |
| 2025 | 0.9% | 0.7% |
Prices rose quickly in 2022 and 2023 and have slowed since.
- Monthly CPI-All Items inflation reached 7.5% in August and September 2022, the highest rate since June 2008 (7.6%).
- Prices fell slightly in 2015, 2016 and 2020 on the CPI-All Items measure.
- From 2020 to 2025 the annual CPI index rose 17.6% in total, a Foundific calculation from SingStat's index.
- From 2015 to 2025 it rose 18.6%.
The core figures are as MAS reported them each January. MAS gave 2.7% for 2024 in its December 2024 report and 2.8% in its December 2025 report, which uses 2024 as the base year.
Inflation by category
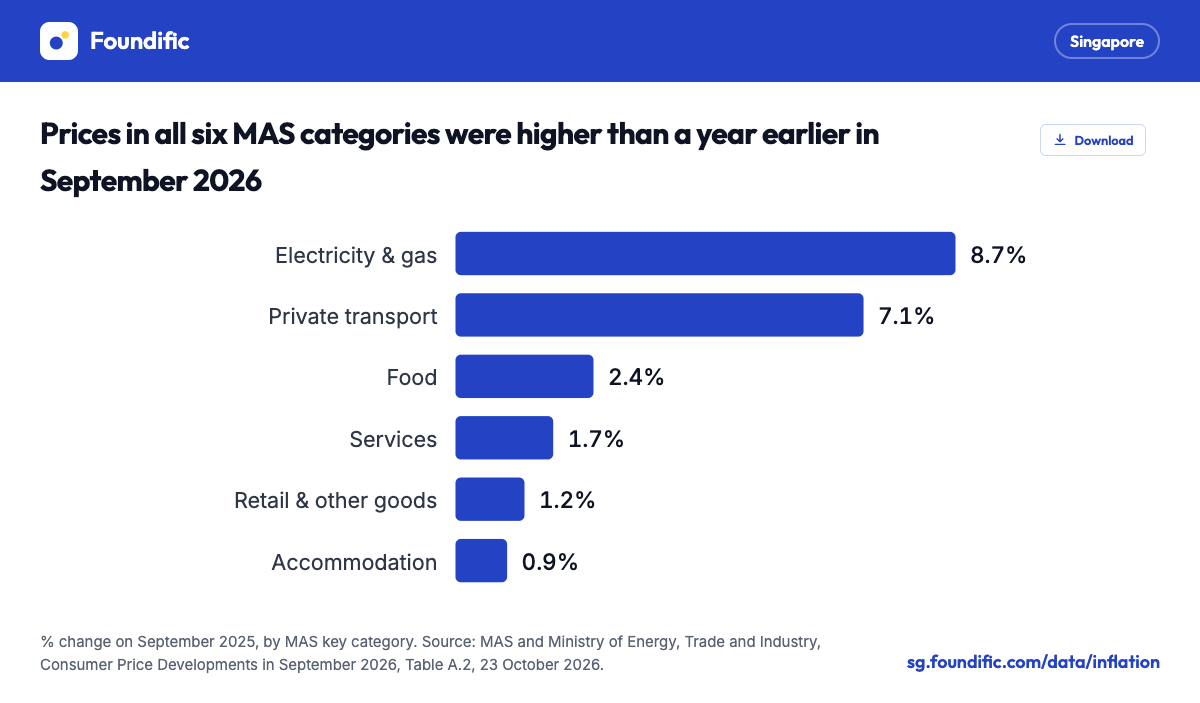
Electricity and gas, and private transport, rose fastest in September 2026.
| MAS category | Weight | August 2026 | September 2026 |
|---|---|---|---|
| Food | 2,042 | 2.3% | 2.4% |
| Services | 3,173 | 2.0% | 1.7% |
| Retail & other goods | 1,025 | 1.8% | 1.2% |
| Electricity & gas | 198 | 8.7% | 8.7% |
| Private transport | 906 | 7.5% | 7.1% |
| Accommodation | 2,656 | 0.8% | 0.9% |
- Private transport slowed as car prices rose more gradually.
- Food rose with higher inflation for both non-cooked food and food services. Prices at hawker centres, food courts, coffee shops and kiosks were 2.4% higher.
- Services eased as point-to-point transport costs rose less and telecommunication prices fell further.
- Accommodation edged up as housing rents rose faster.
SingStat groups the basket into ten divisions. Each weight is the division's share of household spending, out of 10,000.
| Division | Weight | Sep 2026 on Sep 2025 | Jan to Sep 2026 on a year earlier |
|---|---|---|---|
| Food | 2,042 | 2.4% | 1.9% |
| Clothing & footwear | 165 | 2.1% | 0.9% |
| Housing & utilities | 2,938 | 1.4% | 0.8% |
| Household durables & services | 547 | 0.2% | 0.7% |
| Health | 1,008 | 3.6% | 3.6% |
| Transport | 1,307 | 7.4% | 6.3% |
| Information & communication | 381 | -5.0% | -2.5% |
| Recreation, sport & culture | 595 | 0.7% | 1.2% |
| Education | 579 | -0.8% | -0.8% |
| Miscellaneous goods & services | 438 | 2.4% | 1.7% |
Transport and health rose fastest over the year.
- Within transport, private transport rose 7.1% and land transport services 6.6%.
- Within health, health insurance rose 8.6%. Over January to September it averaged 10.8% above the same months of 2025.
- Information and communication services were 6.7% cheaper than a year earlier.
- Prices for general, vocational and higher education fell 2.4%, while private tuition rose 2.4%.
MAS forecast for 2026 and 2027
MAS gave its forecast in the Monetary Policy Statement of 14 October 2026.
| Measure | Forecast for 2026 | Actual, January to September 2026 on a year earlier | Forecast for 2027 |
|---|---|---|---|
| CPI-All Items | around 2.0% | 1.9% | 1.5% to 2.5% |
| MAS core inflation | 1.5% to 2.0% | 1.7% | 1.5% to 2.5% |
- MAS expects core inflation to stay slightly elevated for the next few quarters and to ease from mid-2027.
- MAS sees the risks to inflation as tilted to the upside.
- A sharp and sustained rise in global energy or food prices could lift import costs by more than forecast.
- MAS kept the rate of appreciation of its exchange rate policy band unchanged.
What inflation means for your pay
Your pay keeps its buying power only if it rises at least as fast as prices. At the September 2026 rate of 2.2%, that means an increment of 2.2% or more over the year.
A worked example, a Foundific calculation at the CPI-All Items rate for September 2026:
- Someone earning S$4,000 a month would need S$4,088 a month a year later to buy the same basket, S$88 more.
- If their pay stayed at S$4,000, it would buy what S$3,914 bought a year earlier.
| Pay rise | New monthly pay | Real change after 2.2% inflation |
|---|---|---|
| None | S$4,000 | -2.2% |
| 2% | S$4,080 | -0.2% |
| 3% | S$4,120 | 0.8% |
| 5% | S$4,200 | 2.7% |
Your own costs can rise faster or slower than the CPI. Households that spend more than average on transport or health insurance, which rose 7.4% and 8.6%, are likely to face higher inflation than the headline rate.
MOM's figures show how pay has moved against prices. The wage growth page has the full series.
| Change | In 2025 | 2020 to 2025 | A year, 2020 to 2025 |
|---|---|---|---|
| Median monthly income | 5.0% | 27.4% | 5.0% |
| Median, after inflation | 4.1% | 8.3% | 1.6% |
| Prices (CPI-All Items) | 0.9% | 17.6% |
- The median is for full-time employed residents and includes employer CPF. It was S$5,775 a month in 2025.
MOM's income figures for June 2026 are provisionally due in its advance release between 26 November and 2 December 2026.
How inflation is measured
The CPI tracks the prices of a fixed basket of goods and services bought by resident households. Resident households are those whose reference person is a Singapore citizen or permanent resident.
- The current CPI uses 2024 as its base year, with weights from the Household Expenditure Survey 2023.
- The basket holds 6,800 brands and varieties, priced at about 4,500 outlets.
- Food takes 20.4% of the basket and transport 13.1%, from SingStat's weights.
- The CPI excludes loan repayments, income tax and purchases of houses, shares and other financial assets.
- The annual rate compares the average of a year's 12 monthly indices with the previous year's average.
MAS core inflation is CPI-All Items without accommodation and private transport.
- MAS leaves them out because they are strongly affected by supply-side administrative policies and are volatile.
- The core measure covers 6,438 of the 10,000 weight points in the basket.
Owner-occupied housing enters the CPI as imputed rent.
- Accommodation takes 2,656 of the 10,000 weight points, or 26.6% of the basket.
- Most of it is imputed rent: what homeowners would pay to rent their own homes, estimated from market rents.
- Imputed rent takes 2,138 weight points, or 21.4%, a Foundific calculation from SingStat's weights.
- House prices are left out, because SingStat treats a home as a capital good with a large investment element.
- Imputed rent is not a cash cost for most households, since most own their homes. That is why SingStat also publishes the CPI less imputed rentals and less accommodation.
- The index takes account of Service and Conservancy Charges (S&CC) rebates for Housing and Development Board (HDB) households in the months they are paid. This makes monthly figures more volatile.
Next release
SingStat releases the CPI on about the 23rd of the month after the reference month.
- The October 2026 figures are due on 23 November 2026.
- The November 2026 figures are due on 23 December 2026.
- The December 2026 figures are due on 25 January 2027.
Questions
What is the inflation rate in Singapore?
CPI-All Items inflation was 2.2% in September 2026, year-on-year, and MAS core inflation was 2.0%, according to SingStat and MAS figures released on 23 October 2026.
What is the difference between headline and core inflation?
Headline inflation covers the whole CPI basket. MAS core inflation leaves out accommodation and private transport, which are volatile. In September 2026 the headline rate was 2.2% and the core rate 2.0%.
What is the inflation forecast for Singapore in 2026?
In its Monetary Policy Statement of 14 October 2026, MAS forecast CPI-All Items inflation of around 2.0% for 2026 and MAS core inflation of 1.5% to 2.0%. For 2027 it expects both to average 1.5% to 2.5%.
What was inflation in Singapore in 2025?
CPI-All Items inflation averaged 0.9% in 2025, down from 2.4% in 2024. MAS core inflation averaged 0.7%, down from 2.8%.
Is my pay keeping up with inflation?
Compare your increment with the CPI-All Items rate for the same period. Over the year to September 2026 prices rose 2.2%, so a smaller increment buys less. MOM's median income rose 4.1% after inflation in 2025; see the wage growth page.
Related guides
Sources
SingStat CPI September 2026 and Table Builder, MAS Consumer Price Developments and the MAS Monetary Policy Statement of 14 October 2026
- SingStat, Singapore Consumer Price Index, Sep 2026 Released 23 October 2026. Rates by expenditure division and group (Table 1), weights and the Technical Note.
- MAS, Consumer Price Developments in September 2026 Released 23 October 2026 by MAS and the Ministry of Energy, Trade and Industry. MAS core inflation, key categories (Tables A.1 and A.2) and the outlook.
- MAS, Monetary Policy Statement, 14 October 2026 Forecasts for 2026 and 2027, paragraphs 5 to 9.
- SingStat Table Builder, M213781, CPI year-on-year change, monthly 2024 as base year; updated 23 October 2026.
- SingStat Table Builder, M213811 and M213801, CPI annual change and annual index 2024 as base year; updated 23 January 2026.
- MAS, Consumer Price Developments, December reports 2015 to 2025 Annual MAS core inflation for each year, as reported each January. The 2024 figure is from the December 2025 report.
- SingStat, Advance Release Calendar Release dates for the monthly CPI.
- MOM, Labour Force in Singapore 2025 Released 29 January 2026. Median income growth before and after inflation.