The Ministry of Manpower (MOM) counts job vacancies every quarter. The latest figures are for June 2026 and were released on 21 September 2026.
Job vacancies at a glance
- 68,600 vacancies in June 2026, seasonally adjusted, down from 73,300 in March 2026.
- 1.48 vacancies for each unemployed person in June 2026, against 1.46 in March.
- 2.8% vacancy rate, the share of jobs on offer that were unfilled, seasonally adjusted.
- 17.1% of vacancies open for six months or more in September 2025, down from 39.0% in 2015.
- 31,700 entry-level PMET vacancies in June 2026, 45.3% of all vacancies.
How many job vacancies are there in Singapore?
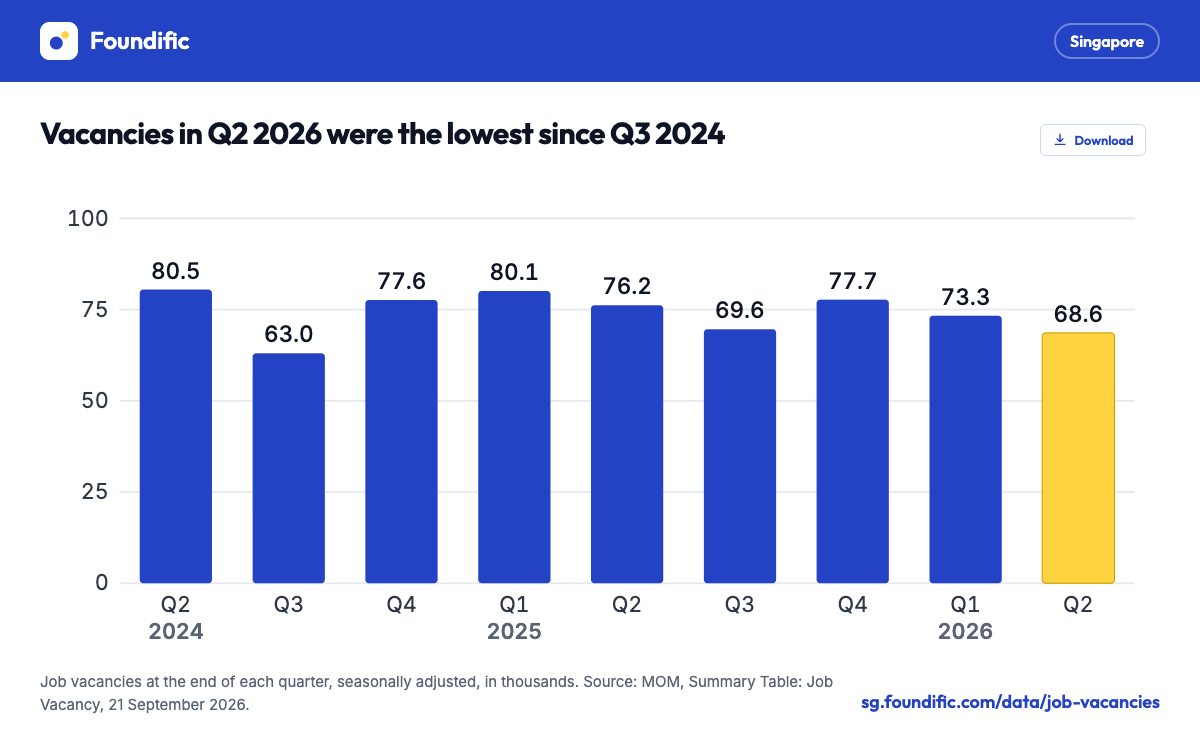
Employers were trying to fill 68,600 posts at the end of June 2026, seasonally adjusted. That was 4,700 fewer than in March 2026 and 7,600 fewer than in June 2025.
| Seasonally adjusted | June 2025 | March 2026 | June 2026 |
|---|---|---|---|
| Job vacancies | 76,200 | 73,300 | 68,600 |
| Vacancy rate | 2.9% | 2.9% | 2.8% |
| Vacancies for each unemployed person | 1.38 | 1.46 | 1.48 |
MOM linked the fall mainly to fewer PMET vacancies in two sectors.
- Financial services (excluding insurance) fell from 5,800 vacancies in March 2026 to 4,500 in June.
- Information and communications fell from 5,300 to 4,400.
- Before seasonal adjustment, vacancies were 69,900 in June 2026, against 78,100 a year earlier.
- MOM estimates that around 7 in 10 vacancies were likely to be filled by residents.
The June 2026 count was 15,700 above the 2019 annual average of 52,900, before COVID-19.
Job vacancies since 2016
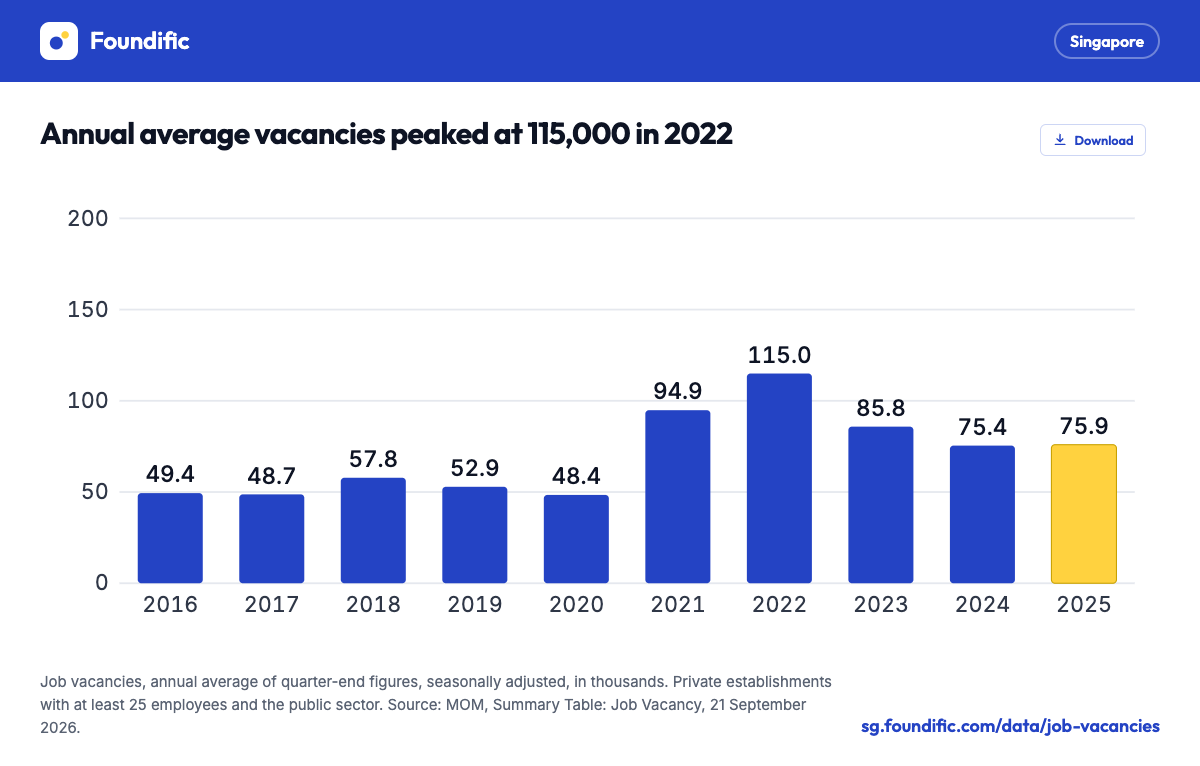
The annual average stayed between 48,400 and 57,800 from 2016 to 2020. It then rose to 94,900 in 2021.
- The annual average reached 115,000 in 2022, and the vacancy rate 5.1%.
- The highest quarter in MOM's summary table was March 2022, with 123,600 vacancies and a rate of 5.5%.
- The average fell to 75,400 in 2024 and was 75,900 in 2025.
- June 2026 was 46,400 below the 2022 average.
Vacancies for each unemployed person
The ratio divides vacancies across the whole economy by the number of unemployed persons. Above 1, vacancies outnumber people looking for work.
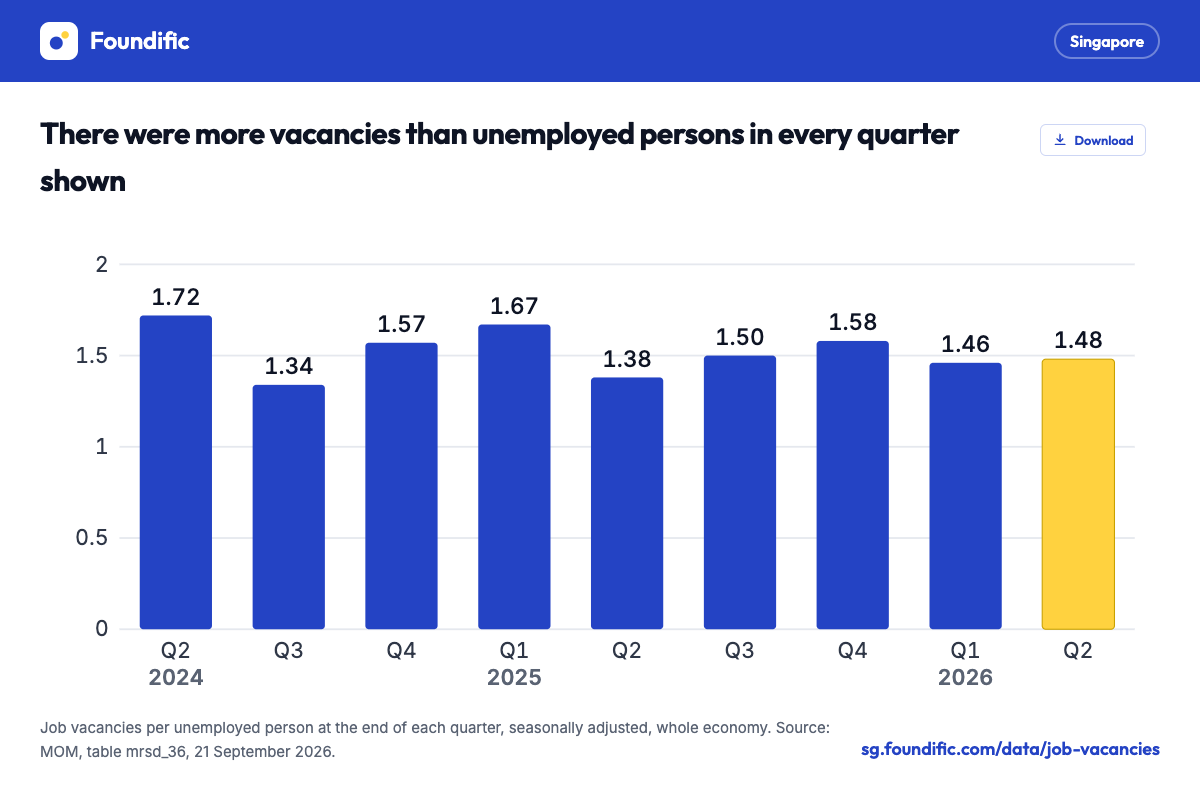
- The ratio has been above 1 in each of the 21 quarters from June 2021 to June 2026.
- It peaked at 2.55 in June 2022, the highest since the series began in 1998.
- The lowest point was 0.21 in September 2003.
- The annual average was 0.91 in 2019, 2.32 in 2022 and 1.53 in 2025.
The unemployment rate page covers the other side of the ratio.
Vacancies by industry
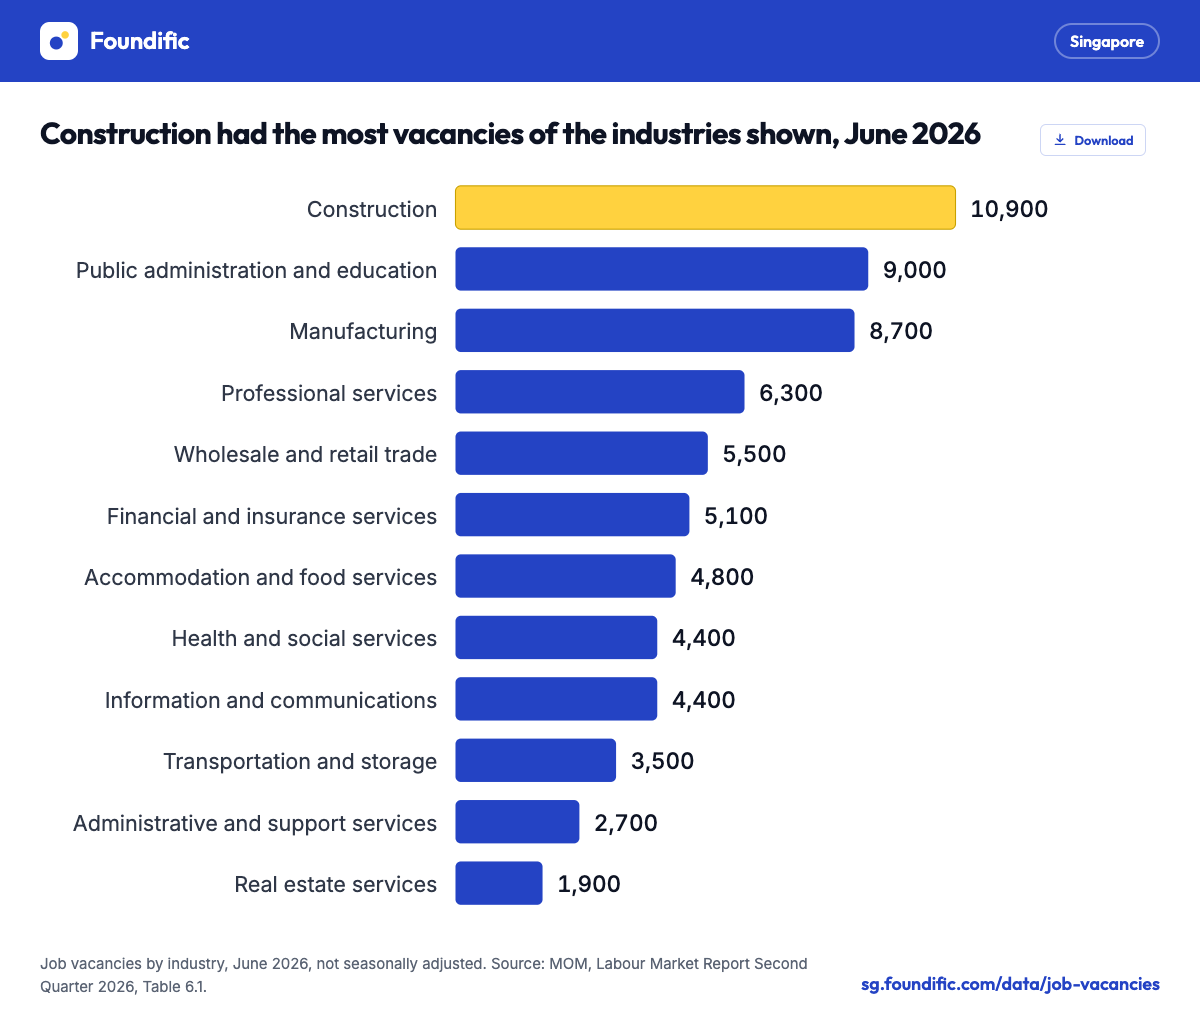
Services industries held 49,700 of the 69,900 vacancies in June 2026.
- Construction vacancies rose by 1,300 over the year, and manufacturing by 1,000.
- Information and communications fell by 1,600.
- Administrative and support services fell by 3,200, to 2,700.
In June 2026 the vacancy rate was 4.8% in public administration and education, 4.4% in IT and other information services, 2.8% in construction and 1.6% in administrative and support services.
Vacancies by occupation
PMET jobs made up 39,300 of the 69,900 vacancies in June 2026, or 56.2%. PMET stands for professionals, managers, executives and technicians.
| Occupation group, not seasonally adjusted | June 2025 | June 2026 | Vacancy rate, June 2026 |
|---|---|---|---|
| PMET | 43,100 | 39,300 | 3.1% |
| Non-PMET | 35,000 | 30,600 | n.a. |
| Clerical, sales and service | 16,700 | 12,800 | 2.9% |
| Production and transport operators, cleaners and labourers | 18,200 | 17,800 | 2.4% |
- PMET vacancies fell by 3,800 over the year, and non-PMET vacancies by 4,400.
- The two non-PMET groups are parts of the non-PMET total.
MOM's Job Vacancies 2025 report puts the PMET share at 56.3% in September 2025, up from 45.4% in 2015.
Jobs with the most vacancies
MOM's Job Vacancy Survey of September 2025 ranks occupations by number of vacancies. The wage range is the gross monthly wage employers were prepared to offer, before employee CPF, without employer CPF or bonuses.
| Rank | PMET occupation | Wage range offered |
|---|---|---|
| 1 | Teaching and training professional | S$2,611 to S$8,580 |
| 2 | Commercial and marketing sales executive | S$3,000 to S$4,350 |
| 3 | Software, web, multimedia and games developer and designer | S$7,000 to S$10,000 |
| 4 | Policy and planning manager | S$4,800 to S$9,700 |
| 5 | Electronics engineer | S$5,000 to S$8,000 |
| 6 | Civil engineer | S$3,500 to S$5,500 |
| 7 | Industrial and production engineer | S$4,200 to S$6,775 |
| 8 | Accountant | S$4,550 to S$6,700 |
| 9 | Systems analyst | S$6,000 to S$9,700 |
| 10 | Financial and investment adviser | S$7,500 to S$12,000 |
| Rank | Non-PMET occupation | Wage range offered |
|---|---|---|
| 1 | Construction labourer | S$800 to S$1,500 |
| 2 | Waiter | S$2,200 to S$2,669 |
| 3 | Shop sales assistant | S$2,305 to S$2,600 |
| 4 | Cleaner | S$1,910 to S$2,310 |
| 5 | Receptionist, customer service and information clerk | S$2,300 to S$3,000 |
| 6 | Security guard | S$2,870 to S$3,000 |
| 7 | Heavy truck and lorry driver | S$2,600 to S$3,500 |
| 8 | Material and freight handling worker | S$1,800 to S$2,450 |
| 9 | General office clerk | S$2,000 to S$3,000 |
| 10 | Kitchen assistant | S$2,155 to S$2,500 |
Source: MOM, Job Vacancies 2025, Tables 3 and 4.
Vacancies open for six months or more
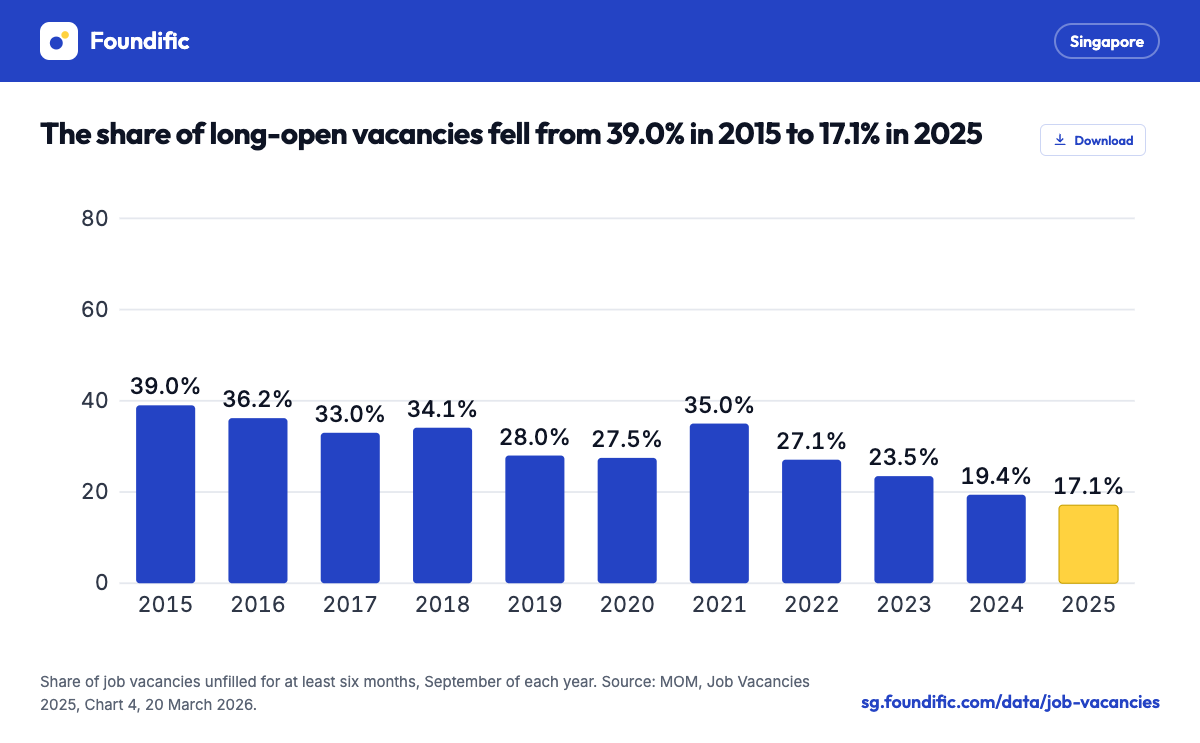
The overall share fell by 2.3 percentage points in 2025, mainly in non-PMET jobs such as drivers, cooks and waiters.
| Share open six months or more | 2024 | 2025 |
|---|---|---|
| All vacancies | 19.4% | 17.1% |
| PMET | 14.4% | 16.0% |
| Non-PMET | 27.2% | 18.6% |
- 74.3% of long-open PMET vacancies asked for 2 or more years of experience.
Employers gave different reasons for each group.
- For PMET jobs, the top reasons were a lack of specialised skills (52.3% of hard-to-fill PMET vacancies) and of work experience (48.2%).
- The PMET jobs most often open for six months included software developers, data scientists, teaching professionals and civil engineers.
- For non-PMET jobs, employers said job seekers found the work physically strenuous (42.9%), the hours long (39.1%) or the pay unattractive (37.4%), as shares of hard-to-fill non-PMET vacancies.
Entry-level PMET vacancies
MOM also tracks entry-level PMET vacancies. These are PMET posts advertised on job portals with a minimum salary of S$2,300 to S$5,000.
| Quarter | Entry-level PMET vacancies | Share of all vacancies |
|---|---|---|
| December 2025 | 32,500 | 42.9% |
| March 2026 | 32,800 | 43.6% |
| June 2026 | 31,700 | 45.3% |
- In December 2025 the share was 54.4% in health and social services and 44.4% in professional services.
MOM compiles this count from its own surveys and online job portals, a different source from the yearly Job Vacancy Survey.
What the figures mean for job seekers
The September 2025 survey shows what employers asked for.
| What employers said | Share of vacancies |
|---|---|
| No work experience needed | 31.5% |
| One year of experience needed | 20.2% |
| Academic qualifications not the main hiring factor | 79.6% |
| Would consider candidates below the stated qualification | 66.9% |
| Could be done remotely | 22.7% (14.4% in 2024) |
- For PMET vacancies, 21.1% needed no experience and 51.1% needed 2 to 5 years.
To compare an offer with MOM's median pay for the same job, use the salary comparison or the salary guides by occupation. Pay trends are on the wage growth page.
How MOM measures job vacancies
- A job vacancy is an unfilled post that an employer is actively recruiting for from outside the organisation.
- Posts already filled by someone yet to start, and posts open only to internal transfers or promotions, are excluded.
- The quarterly Labour Market Survey covers private establishments with at least 25 employees and, since 2006, the public sector.
- The vacancy rate is vacancies divided by the demand for manpower, which is employees plus vacancies.
- For the ratio, MOM assumes that firms with fewer than 25 employees have the same vacancy rate as firms with 25 to 49 employees.
- Quarterly figures are seasonally adjusted with X-12 ARIMA and revised each year.
- The June 2026 count before adjustment, 69,900, had a 95% confidence interval of 67,600 to 72,300.
- The yearly Job Vacancy Survey had a reference date of 30 September 2025 and a response rate of 85.9%.
- MOM writes quarters as "Q2 2026"; this page writes "Q2 2026".
Release calendar
Vacancy figures appear in the full Labour Market Report, published in the third month after each quarter ends.
- The Labour Market Report for Q3 2026 is scheduled for 10 to 16 December 2026 and will carry September 2026 vacancies.
- The Labour Market Advance Release for Q3 2026, due 29 to 30 October 2026, does not include vacancies.
- The Job Vacancies 2025 report was released on 20 March 2026. MOM's release calendar of 21 September 2026 does not yet list the 2026 report.
Questions
How many job vacancies are there in Singapore?
MOM counted 68,600 job vacancies at the end of June 2026, seasonally adjusted, or 69,900 before adjustment. The figures cover private establishments with at least 25 employees and the public sector. They were released in the Labour Market Report on 21 September 2026.
Are there more job vacancies than unemployed people in Singapore?
Yes. In June 2026 there were 1.48 vacancies for each unemployed person, seasonally adjusted. The ratio has been above 1 in every quarter since June 2021, and peaked at 2.55 in June 2022.
Which jobs have the most vacancies in Singapore?
In MOM's September 2025 survey, teaching and training professionals had the most PMET vacancies, followed by commercial and marketing sales executives and software developers. Construction labourers, waiters and shop sales assistants led the non-PMET list.
When are the next job vacancy figures released?
The Labour Market Report for Q3 2026 is scheduled for 10 to 16 December 2026 and will carry the September 2026 figures.
Related guides
Sources
MOM Summary Table: Job Vacancy, job vacancy time series, Labour Market Report Q2 2026 and Job Vacancies 2025
- MOM, Summary Table: Job Vacancy Released 21 September 2026. Seasonally adjusted vacancies, vacancy rate and vacancy-to-unemployed ratio, 2016 to June 2026.
- MOM, Statistical Table: Job Vacancy (tables mrsd_23, mrsd_24 and mrsd_36) Released 21 September 2026. Vacancies and vacancy rates by industry and occupation; the vacancy-to-unemployed ratio since 1998.
- MOM, Labour Market Report, Second Quarter 2026 Released 21 September 2026. Pages 18 to 19, Tables 6.1 to 6.3, definitions, sampling errors and release calendar (page A29).
- MOM, Labour Market Report Second Quarter 2026, press release Released 21 September 2026. Entry-level PMET vacancies in March and June 2026.
- MOM, Report: Job Vacancies 2025 Released 20 March 2026. Job Vacancy Survey at 30 September 2025: long-open vacancies, hard-to-fill reasons, requirements and the top 10 vacancies (Tables 3 and 4).