The Ministry of Manpower (MOM) counts the change in employment every quarter. The latest full figures are for Q2 2026 and were released on 21 September 2026.
Employment growth at a glance
| Excluding migrant domestic workers | Q2 2025 | Q1 2026 | Q2 2026 |
|---|---|---|---|
| Total employment change | 10,400 | 9,400 | 11,400 |
| Resident | 2,600 | 5,400 | 2,200 |
| Non-resident | 7,800 | 4,100 | 9,200 |
- 11,400 more people in work in Q2 2026, excluding migrant domestic workers (MDW), up from 9,400 in Q1 2026.
- 2,200 more residents in work, down from 5,400 in Q1 2026.
- 9,200 more non-residents in work, up from 4,100.
- 19 quarters of growth in a row, from Q4 2021 to Q2 2026.
- 4,144,700 people in employment in June 2026, including MDW.
How fast is employment growing in Singapore?
Total employment grew by 11,400 in Q2 2026, excluding migrant domestic workers. Non-residents made up 9,200 of the increase and residents 2,200.
The Q2 2025 resident and non-resident figures are from MOM's Labour Market Report Second Quarter 2025. MOM's report for Q2 2026 gives these details.
- Non-resident growth came mainly from Work Permit holders in construction and manufacturing.
- Resident gains were in transportation and storage, public administration and education, and health and social services.
- Professional services, financial services, and information and communications also recorded resident employment gains.
- Employment was 3,820,900 in June 2026, excluding MDW.
- Over the four quarters to June 2026, employment grew by 63,600, excluding MDW.
The economy grew 5.9% year-on-year in Q2 2026, according to the Ministry of Trade and Industry, after 6.3% in Q1 2026.
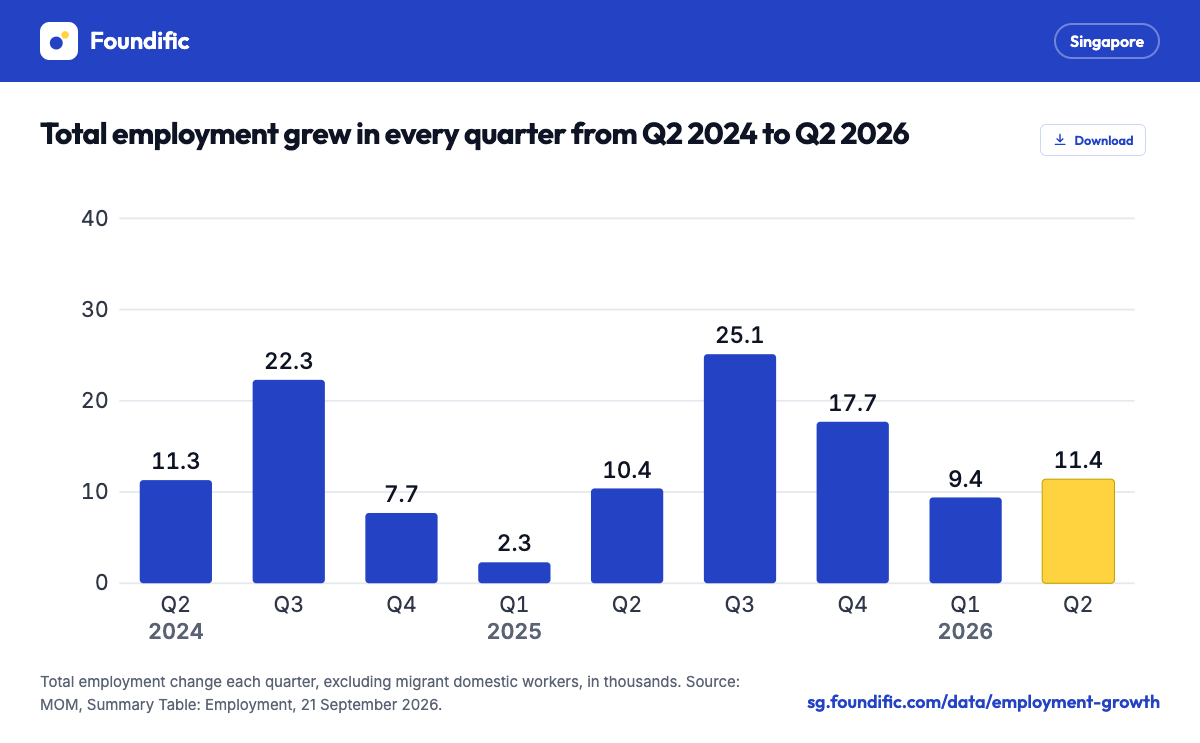
Employment change each quarter
The last fall was in Q3 2021, when employment excluding MDW fell by 7,100.
- The rise of 25,100 in Q3 2025 was the largest since Q1 2023, when employment grew by 33,500.
- In 2020, quarterly falls ranged from 7,900 in Q4 to 103,800 in Q2.
MOM's Employment Diffusion Index, which shows how widely employment grew across sectors, was 49.0 in Q2 2026, against 48.5 in Q1. A reading of 50 means as many sectors grew as shrank.
Employment change by sector
These figures include migrant domestic workers, who are counted in services.
| Including MDW, thousands | Q2 2025 | Q3 2025 | Q4 2025 | Q1 2026 | Q2 2026 |
|---|---|---|---|---|---|
| Total | 12.9 | 30.2 | 20.8 | 13.0 | 14.7 |
| Manufacturing | 0.9 | 5.5 | 2.4 | -0.2 | 3.0 |
| Construction | 5.8 | 13.8 | 8.8 | 2.5 | 7.2 |
| Services | 6.2 | 10.3 | 9.8 | 10.9 | 4.9 |
Change in thousands, including migrant domestic workers. Source: MOM, Labour Market Report Second Quarter 2026, Table 1.1.
Construction employment rose by 7,200 in Q2 2026, manufacturing by 3,000 and services by 4,900.
- In manufacturing, electronic, computer and optical products added 1,700, and petroleum, chemical and pharmaceutical products 1,500.
- Transportation and storage added 2,400, health and social services 1,600 and financial and insurance services 1,400.
- Employment fell by 2,300 in wholesale and retail trade, and by 2,200 in accommodation and food services.
- It fell by 1,600 in administrative and support services.
In June 2026, services employed 3,040,100 people, construction 577,400 and manufacturing 501,000.
Annual employment change since 2016
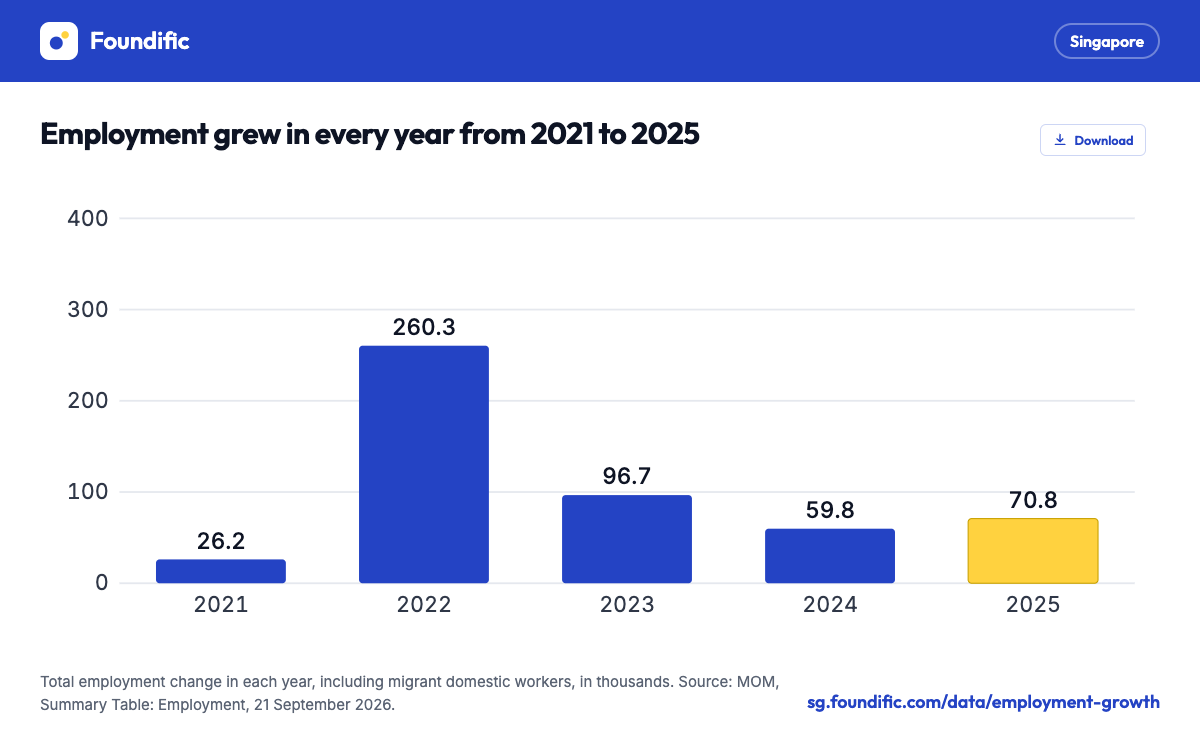
The table shows every year from 2016, including the falls in total employment in 2017 and 2020.
| Year | Total | Total excluding MDW | Resident | Non-resident excluding MDW |
|---|---|---|---|---|
| 2016 | 17.1 | 8.9 | 11.4 | -2.5 |
| 2017 | -3.6 | -10.7 | 21.3 | -32.0 |
| 2018 | 45.3 | 38.3 | 27.4 | 10.9 |
| 2019 | 69.5 | 61.5 | 28.0 | 33.4 |
| 2020 | -181.0 | -166.6 | 14.9 | -181.5 |
| 2021 | 26.2 | 27.3 | 57.3 | -30.0 |
| 2022 | 260.3 | 238.0 | 36.5 | 201.6 |
| 2023 | 96.7 | 78.8 | -4.6 | 83.5 |
| 2024 | 59.8 | 44.5 | 8.8 | 35.7 |
| 2025 | 70.8 | 55.5 | 11.6 | 43.9 |
Change in thousands. Source: MOM, Summary Table: Employment.
- Employment, including migrant domestic workers, fell by 181,000 in 2020, the largest fall from 2016 to 2025, as non-resident employment including MDW fell by 195,900.
- Resident employment grew by 14,900 in 2020.
- The rise of 260,300 in 2022, including MDW, was the largest from 2016 to 2025, with 223,800 more non-residents, including MDW, in work.
- Resident employment fell by 4,600 in 2023, its only fall from 2016 to 2025.
Resident growth has slowed. MOM put the average quarterly gain at 4,400 from 2015 to 2019 and at 500 from 2023 to 2024.
Employment by sector in 2025
| 2025, thousands | Total change | Resident | Non-resident, including MDW | Share of employment, December 2025 |
|---|---|---|---|---|
| Manufacturing | 8.4 | 0.3 | 8.0 | 12.1% |
| Construction | 27.3 | 1.3 | 26.0 | 13.8% |
| Services | 34.9 | 9.6 | 25.2 | 73.5% |
- Non-residents made up 26,000 of the 27,300 rise in construction and 8,000 of the 8,400 rise in manufacturing.
- In services, non-resident employment excluding MDW grew by 10,000.
- Construction's share of year-end employment rose from 11.2% in 2020 and 2021 to 13.8% in 2025.
Total employment level
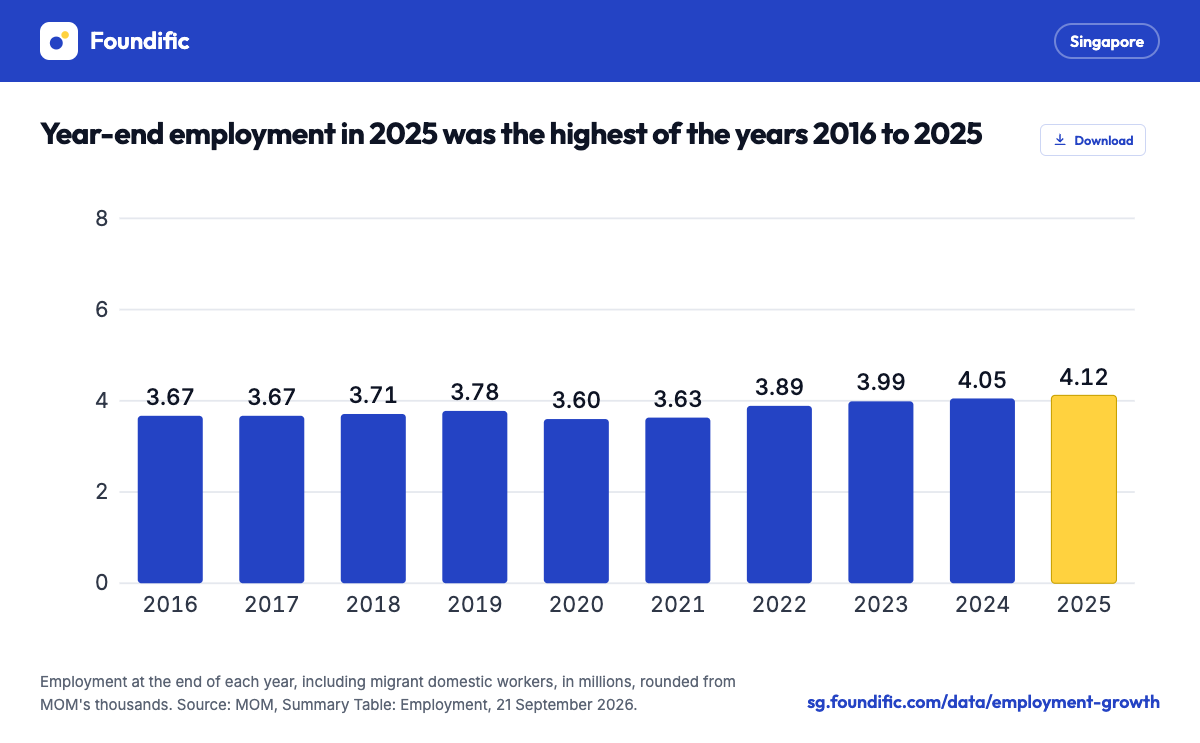
Employment stood at 4,117,000 in December 2025, including MDW.
- Excluding MDW, it was 3,800,100, so MOM's two totals imply 316,900 migrant domestic workers.
- 2,481,300 residents were in employment, 65.3% of employment excluding MDW (Foundific calculation).
- 1,318,800 non-residents excluding MDW were in employment.
- Employment at the end of 2020, 3,603,300, was below the 3,784,300 at the end of 2019.
What the figures mean for job seekers
Most of the growth in Q2 2026 and in 2025 was among non-residents, who work on MOM work passes. Resident gains in Q2 2026 came in both domestic-oriented and outward-oriented sectors.
- Firms intending to hire in the next three months rose from 43.9% in June 2026 to 48.7% in July, in MOM's polls.
- Firms intending to raise wages eased from 29.3% to 27.9%.
- Employment fell in wholesale and retail trade, and in accommodation and food services, in Q2 2026.
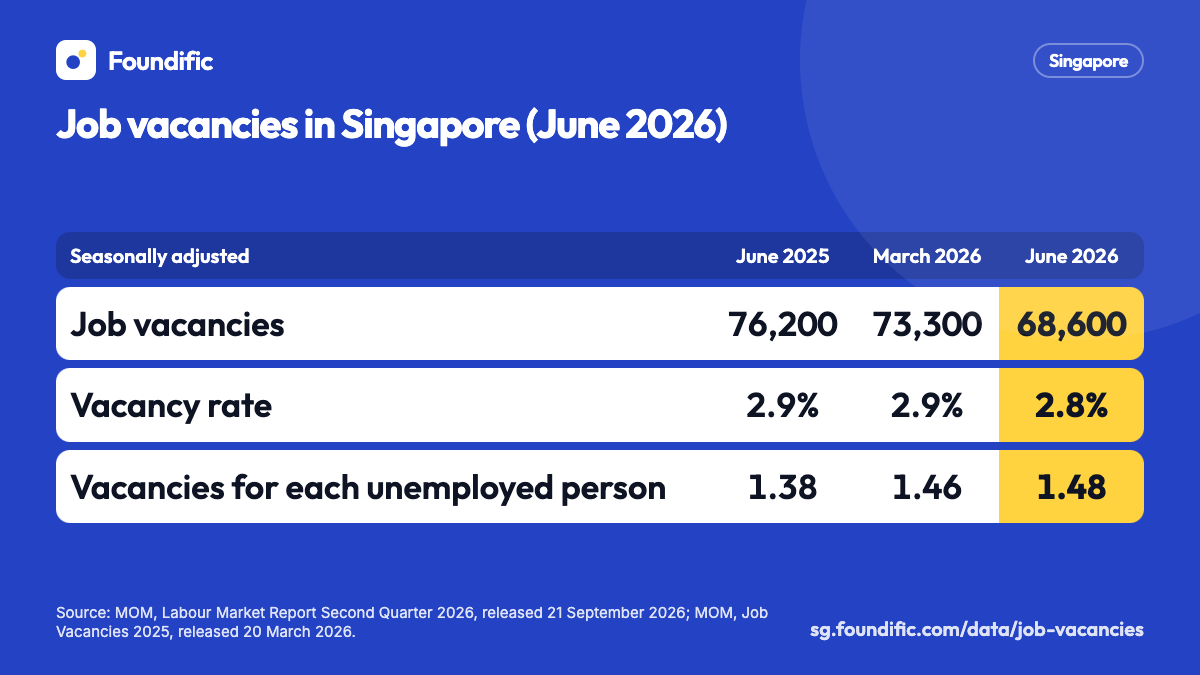
Employment change counts people in work, so it does not show how many jobs are open. Vacancies are on the job vacancies page, job losses on the retrenchments page and joblessness on the unemployment rate page.
How MOM measures employment
- Employment covers employees and the self-employed, but not men serving full-time national service.
- Resident employees are counted from CPF Board records of active contributors. Residents are Singapore citizens and permanent residents.
- Non-residents are counted from MOM's records of valid work passes.
- The self-employed are estimated from the Labour Force Survey.
- Employment change is the level at the end of a period minus the level at the end of the period before.
- MOM's report and press releases quote employment excluding MDW; its industry table includes them.
- An increase is a net change, the difference between people starting and leaving work, and not the number of jobs created.
- The advance estimate for Q2 2026, released on 31 July 2026, was 10,700. The full report revised it to 11,400.
- MOM writes quarters as "Q2 2026"; this page writes "Q2 2026".
Release calendar
MOM publishes employment change twice for each quarter.
- The Labour Market Advance Release for Q3 2026 is scheduled for 29 to 30 October 2026 (provisional), with total employment change.
- The Labour Market Report for Q3 2026 is scheduled for 10 to 16 December 2026 (provisional), with the resident, non-resident and sector figures.
Questions
How much did employment grow in Singapore in Q2 2026?
Total employment grew by 11,400 in Q2 2026, excluding migrant domestic workers, according to MOM's Labour Market Report released on 21 September 2026. Including them, it grew by 14,700.
Is employment growth in Singapore mostly residents or foreigners?
In Q2 2026, non-residents made up 9,200 of the 11,400 increase and residents 2,200. In 2025, resident employment grew by 11,600 and non-resident employment, excluding migrant domestic workers, by 43,900.
How many people are employed in Singapore?
MOM counted 4,144,700 people in employment in June 2026, including migrant domestic workers, or 3,820,900 excluding them.
When is the next employment growth figure released?
The Labour Market Advance Release for Q3 2026 is scheduled for 29 to 30 October 2026 (provisional). The full report follows from 10 to 16 December 2026 (provisional).
Related guides
Sources
MOM Summary Table: Employment, Labour Market Report Q2 2026 and Q2 2025, and the Labour Market Advance Release Q2 2026
- MOM, Summary Table: Employment Released 21 September 2026. Year-end employment level and sector shares 2016 to 2025; quarterly total employment change with and without MDW, 2016 to Q2 2026; annual change by sector and residential status 2016 to 2025, and levels at December 2025.
- MOM, Labour Market Report, Second Quarter 2026 Released 21 September 2026. Pages 1 to 4 (resident and non-resident change, Employment Diffusion Index), Table 1.1 (page A1), data notes (page A22) and release calendar (page A29).
- MOM, Labour Market Report Second Quarter 2026, press release Released 21 September 2026. Nineteenth consecutive quarter of growth; hiring and wage expectations.
- MOM, Labour Market Advance Release Second Quarter 2026, press release Released 31 July 2026. Advance estimate of employment change in Q2 2026.
- MOM, Labour Market Report, Second Quarter 2025 Released 17 September 2025. Resident and non-resident change in Q2 2025, and average quarterly resident growth (page 3, footnote 4).