The Ministry of Manpower (MOM) publishes the hours employees are paid for each week, every quarter. The latest figures are for June 2026 and were released on 21 September 2026.
Working hours at a glance
| Hours a week per employee | June 2025 | March 2026 | June 2026 |
|---|---|---|---|
| Total paid hours | 43.2 | 42.9 | 43.0 |
| Standard hours (total minus overtime) | 41.2 | 41.2 | 41.3 |
| Paid overtime hours | 2.0 | 1.7 | 1.7 |
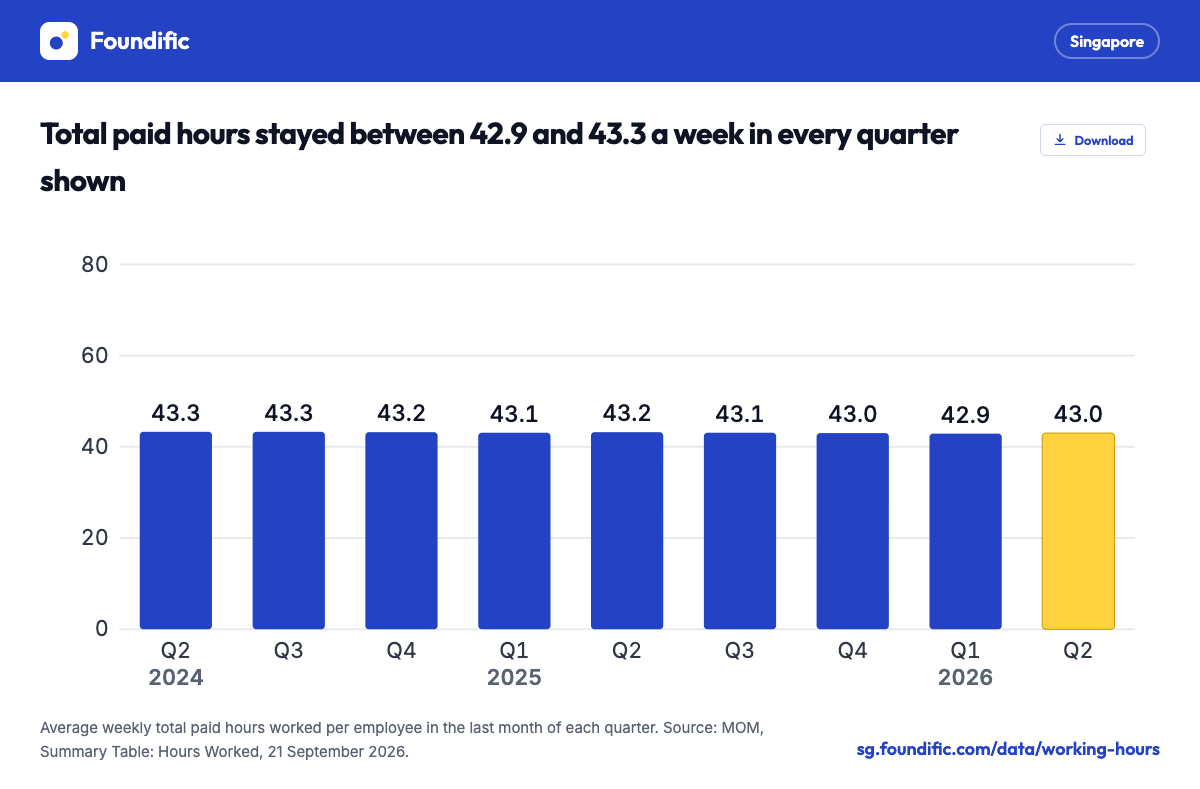
- 43.0 total paid hours a week per employee in June 2026, against 42.9 in March 2026.
- 1.7 paid overtime hours a week in June 2026, unchanged from March.
- 41.3 standard hours a week, total paid hours minus overtime (Foundific calculation).
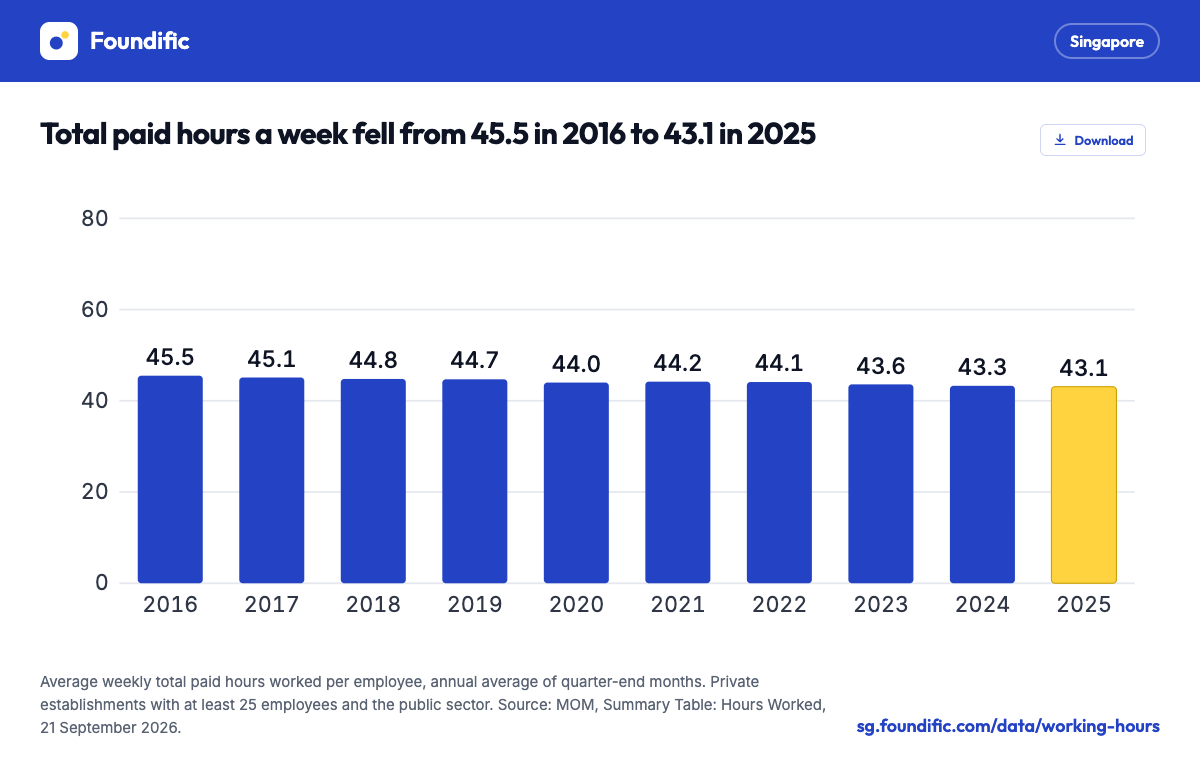
- 43.1 total paid hours a week in 2025, the lowest annual average in MOM's series from 2006 to 2025.
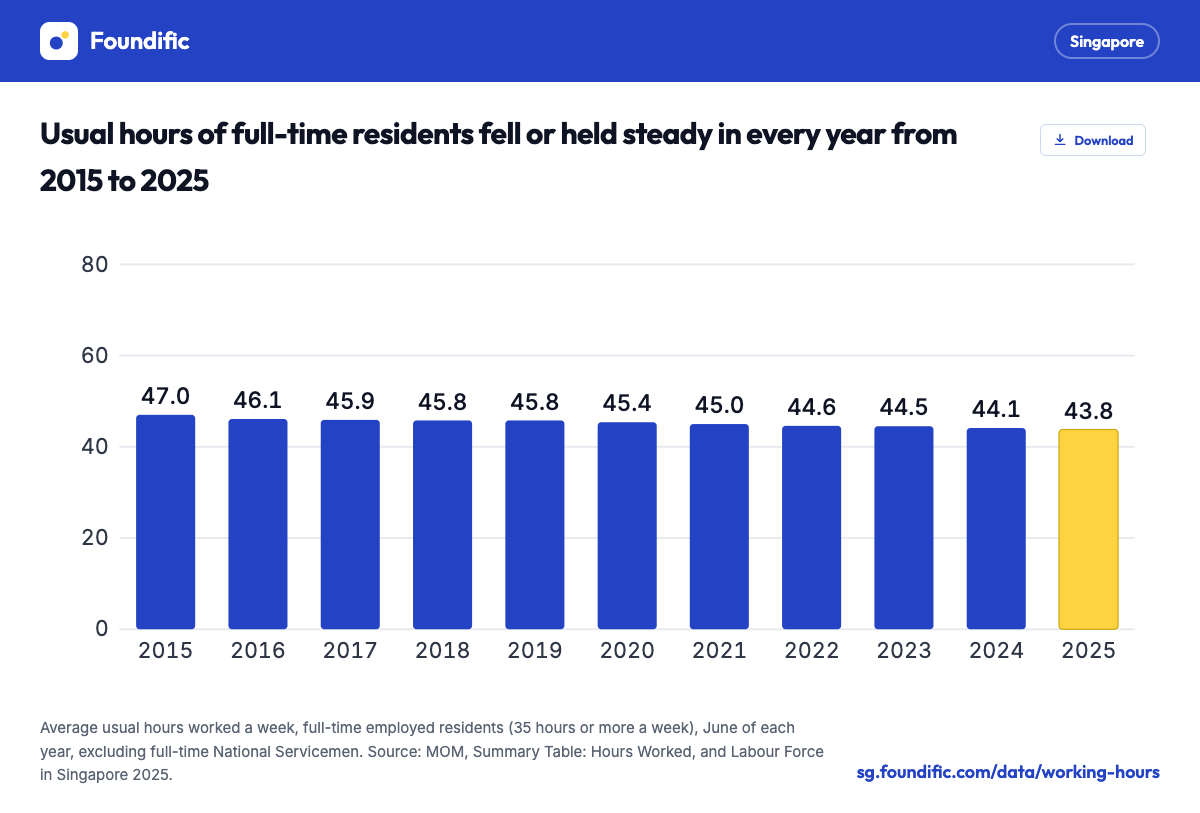
- 43.8 usual hours a week for full-time employed residents in June 2025, down from 47.0 in 2015.
How many hours do employees in Singapore work?
Employees were paid for an average of 43.0 hours a week in June 2026, including 1.7 hours of overtime. Both figures were broadly unchanged from March 2026, MOM said.
Total paid hours are standard hours plus paid overtime. MOM publishes the total and the overtime figure; the standard row is the difference.
- MOM said both measures have continued a longer-term fall over the past decade.
- The 42.9 hours of March 2026 was the lowest quarter in the series from 2006 to June 2026.
- The June 2026 overtime figure had a 95% confidence interval of 1.7 to 1.8 hours.
Paid hours since 2016
Total paid hours fell by 2.4 hours a week between 2016 and 2025. The only yearly rise in that period was in 2021.
- The annual average was highest at 46.3 hours in 2007 and 2008, in the series since 2006.
- In June 2020 total paid hours were 43.4 and overtime 1.4, the lowest overtime quarter in the series from 2006.
- Standard hours, worked out as total minus overtime, went from 42.2 in 2016 to 41.2 in 2025.
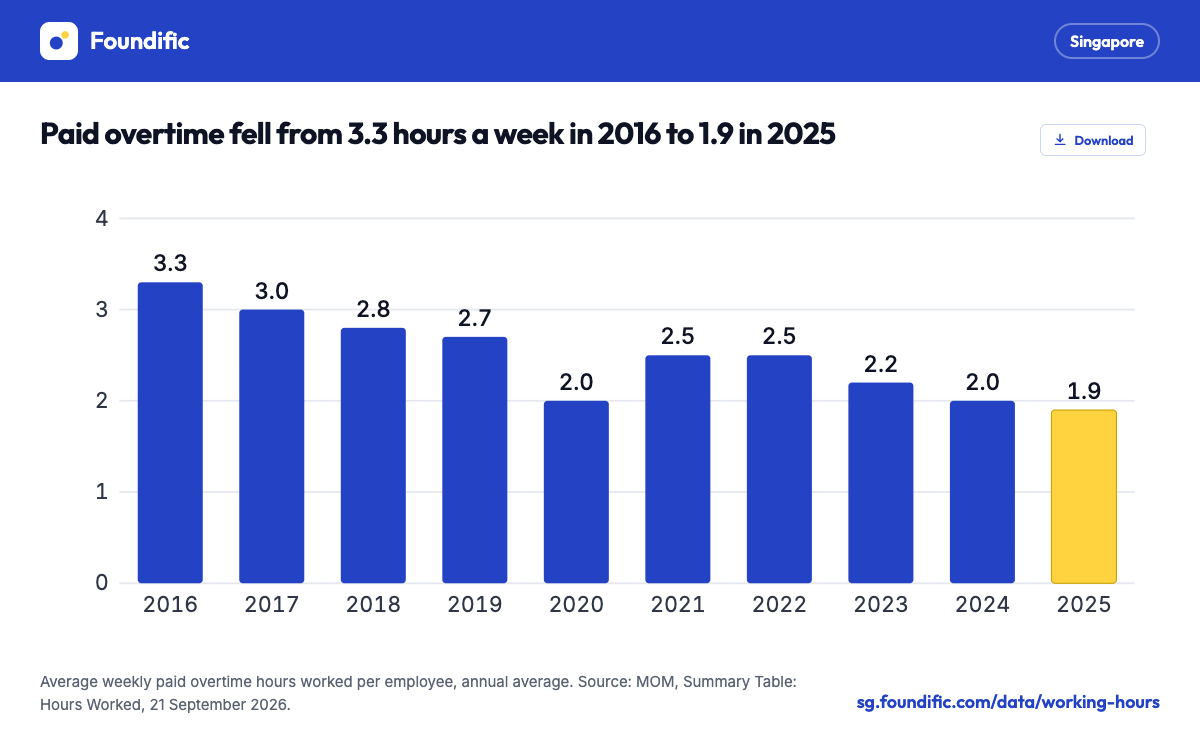
Paid overtime fell by 1.4 hours a week over the same period. The 2025 average of 1.9 hours was the lowest annual figure in the series from 2006 to 2025.
Paid hours by industry
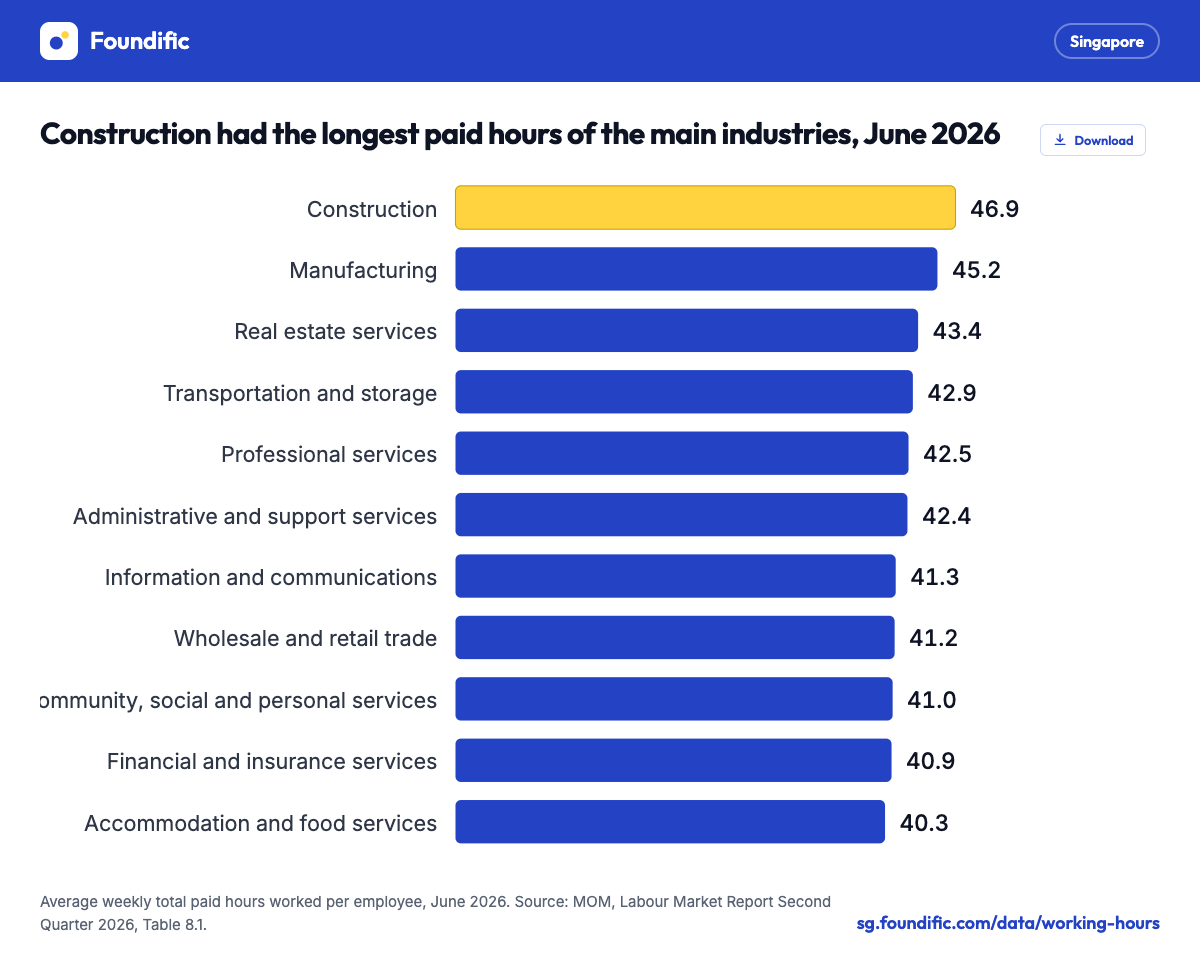
Construction had the longest paid hours of the main industries in every quarter from June 2025 to June 2026. Its June 2026 figure was 6.6 hours above accommodation and food services.
- Construction edged up from 46.8 hours in March 2026 to 46.9 in June.
- Retail trade rose from 39.7 to 40.3 hours, and arts, entertainment and recreation from 40.8 to 41.1.
- Information and communications rose from 40.9 to 41.3 hours.
- Air transport and supporting services fell from 42.9 to 38.8 hours.
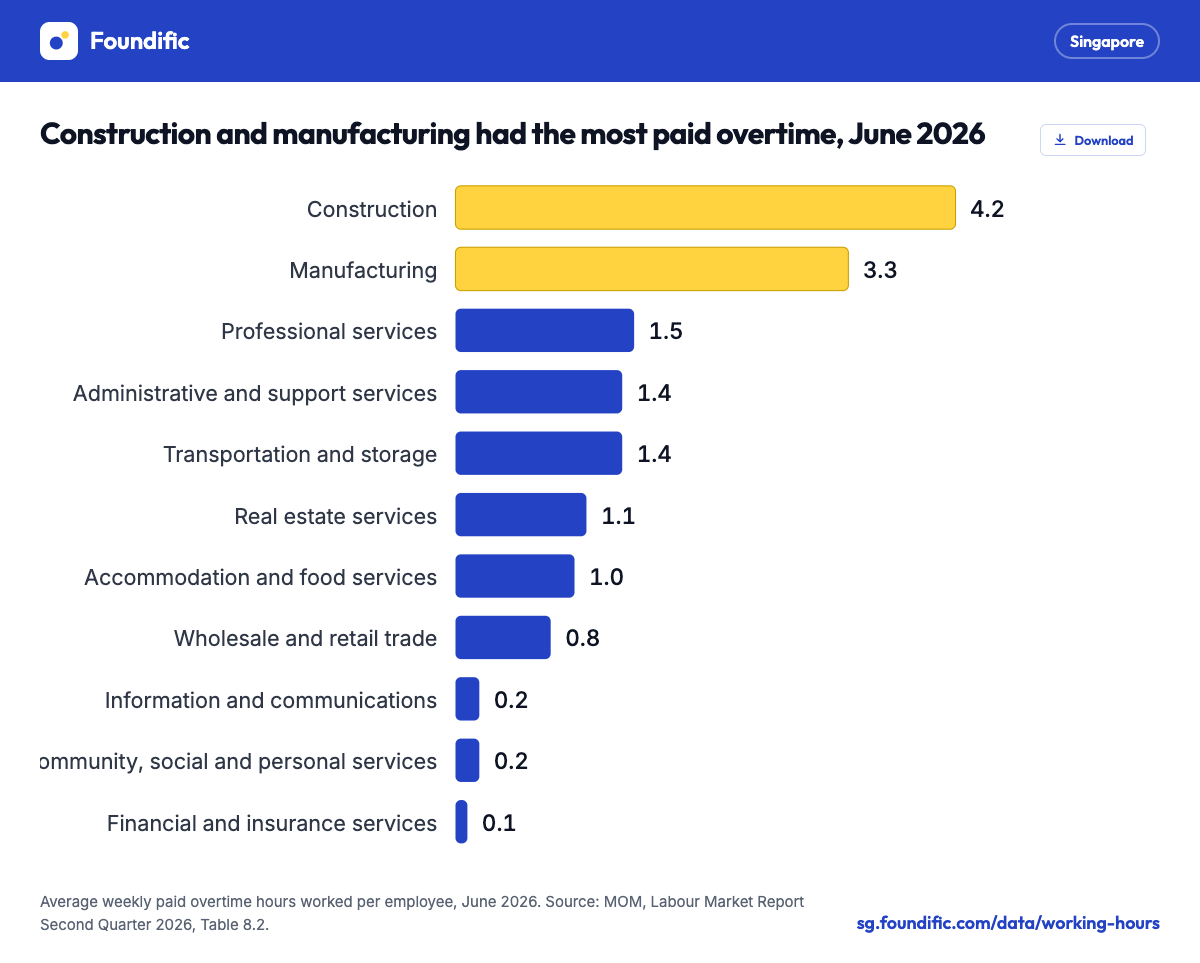
Within manufacturing, transport equipment had 4.2 hours of overtime in June 2026. Architectural and engineering services, part of professional services, had 3.5 hours.
Ten years of change by industry
Construction paid hours fell by 4.6 hours a week between 2016 and 2025, the largest fall of the industries shown.
| Annual average, hours a week | 2016 total | 2025 total | 2016 overtime | 2025 overtime |
|---|---|---|---|---|
| Construction | 52.0 | 47.4 | 7.7 | 4.7 |
| Manufacturing | 48.9 | 45.4 | 5.9 | 3.4 |
| Administrative and support services | 46.7 | 42.5 | 4.7 | 1.5 |
| All services | 43.2 | 41.6 | 1.6 | 0.9 |
- Construction overtime fell by 3.0 hours a week over the decade.
- Financial and insurance services moved from 41.1 to 40.8 hours.
Usual hours of full-time employed residents
Paid hours leave out unpaid overtime. MOM notes that managers and executives are normally not paid for overtime, and points to usual hours for this group. MOM's yearly Labour Force Survey asks residents how many hours they usually work, paid or not, across all jobs.
Full-time usual hours fell by 3.2 hours a week from 2015 to 2025. The 2025 figure of 43.8 was the lowest since the current full-time definition began in 2009.
- All employed residents usually worked 41.4 hours in 2025, against 41.6 in 2024.
- Part-time workers usually worked 20.3 hours, down from 21.1.
- Full-time PMETs went from 46.5 hours in 2015 to 43.5 in 2025.
- Full-time non-PMETs went from 47.7 hours to 44.6.
- 15.5% of full-time employed residents usually worked more than 48 hours in 2025, from 16.9% in 2024 and 29.4% in 2015.
- The share of full-time employees on a five-day week rose from 44.3% in 2008 to 60.8% in 2024.
MOM linked the fall to a more regular workweek, fewer excessive hours and more full-time PMET jobs. It also cited training, technology and flexible work arrangements.
Usual hours by income
| Full-time resident employees, gross monthly income | 2015 | 2025 |
|---|---|---|
| Below S$2,000 | 46.1 | 41.2 |
| S$2,000 to S$4,999 | 46.0 | 43.4 |
| S$5,000 to S$9,999 | 46.5 | 43.3 |
| S$10,000 and over | 48.6 | 44.6 |
- Income bands are gross monthly income from employment, excluding employer CPF.
- The highest earners usually worked the longest hours in both years.
- Hours in the lowest band fell by 4.9 a week, and in the top band by 4.0.
Employment Act limits on hours
MOM's hours of work page sets out the limits for employees covered by Part 4 of the Employment Act. Part 4 does not cover managers and executives.
- For common work arrangements, contractual hours are up to 44 hours a week: up to 9 hours a day on 5 days or less a week, or 8 hours a day on more than 5 days.
- Other arrangements allow up to 48 hours in a week, or shifts of up to 12 hours a day, if the average over 2 or 3 weeks stays at 44.
- Employees may not work more than 12 hours a day, except in cases such as accidents or urgent work.
- Overtime is capped at 72 hours a month unless the employer has an exemption.
- Overtime is paid at least 1.5 times the hourly basic rate.
- Overtime pay covers non-workmen earning a basic S$2,600 a month or less and workmen earning S$4,500 or less.
- Employees get 1 rest day a week.
The overtime pay calculator works out the hourly basic rate and overtime pay with MOM's formula.
How MOM measures working hours
- Total paid hours are the paid hours an employee worked in a week, standard hours plus paid overtime.
- Standard hours exclude meal breaks. Paid overtime excludes overtime given back as time off.
- Paid hours include paid hours not worked, such as paid leave.
- The quarterly Labour Market Survey covers private establishments with at least 25 employees and, since 2006, the public sector.
- Quarterly figures refer to the last month of each quarter. Annual figures are the averages of the four quarters.
- Usual hours come from the Comprehensive Labour Force Survey in June and cover residents (citizens and permanent residents).
- Actual hours per employed person, a third measure, were 43.5 in 2025 and 43.6 in Q2 2026 (preliminary).
- Standard hours on this page are Foundific's calculation from MOM's rounded figures.
- MOM writes quarters as "Q2 2026"; this page writes "Q2 2026".
Release calendar
Paid hours appear in the full Labour Market Report, published in the third month after each quarter ends.
- The Labour Market Report for Q3 2026 is scheduled for 10 to 16 December 2026, with September 2026 paid hours.
- MOM's Summary Table lists the Labour Market Report as where the latest paid hours are published.
- Labour Force in Singapore 2026, with June 2026 usual hours, is scheduled for 25 to 29 January 2027.
Questions
How many hours a week do people work in Singapore?
Employees were paid for an average of 43.0 hours a week in June 2026, including 1.7 hours of overtime. Full-time employed residents usually worked 43.8 hours a week in June 2025, paid or not.
What is the maximum working hours in Singapore?
Part 4 of the Employment Act, which excludes managers and executives, sets contractual hours of up to 44 a week, or 44 on average under other arrangements. Work is limited to 12 hours a day and overtime to 72 a month except in emergencies or with an exemption.
Which industry has the longest working hours in Singapore?
Construction, with 46.9 total paid hours a week per employee in June 2026, including 4.2 hours of overtime. Accommodation and food services had the shortest paid hours of the main industries, at 40.3.
Are working hours in Singapore falling?
Total paid hours fell from 45.5 a week in 2016 to 43.1 in 2025, and paid overtime from 3.3 to 1.9 hours. Usual hours of full-time residents fell from 47.0 in 2015 to 43.8 in 2025.
When are the next working hours figures released?
The Labour Market Report for Q3 2026 is scheduled for 10 to 16 December 2026 and will carry September 2026 paid hours.
Related guides
Sources
MOM Summary Table: Hours Worked, hours worked time series, Labour Market Report Q2 2026, Labour Force in Singapore 2025 and MOM's hours of work page
- MOM, Summary Table: Hours Worked Released 21 September 2026. Total and overtime paid hours per employee, 2016 to June 2026; usual hours per employed resident, 2015 to 2025; actual hours per employed person.
- MOM, Statistical Table: Hours Worked (tables mrsd_21, mrsd_22, mrsd_35 and mrsd_73) Paid hours by industry since 2006 (mrsd_21, mrsd_22), released 21 September 2026; usual hours by nature of employment since 1999 (mrsd_35) and of full-time resident employees by income (mrsd_73), released 29 January 2026.
- MOM, Labour Market Report, Second Quarter 2026 Released 21 September 2026. Page 21 and Tables 8.1 and 8.2 (hours by industry), definitions (page A28), sampling error (page A29) and release calendar.
- MOM, Labour Force in Singapore 2025 Released 29 January 2026. Section 4, Usual Hours Worked, pages 48 to 49.
- MOM, Hours of work, overtime and rest day Last updated 24 July 2025. Employment Act Part 4 limits on normal hours, daily hours and monthly overtime.