The Singapore Department of Statistics (SingStat) publishes household income figures once a year. The latest, for 2025, were released on 9 February 2026. SingStat marks the 2025 figures as preliminary.
Household income at a glance
| Measure | 2023 | 2024 | 2025 |
|---|---|---|---|
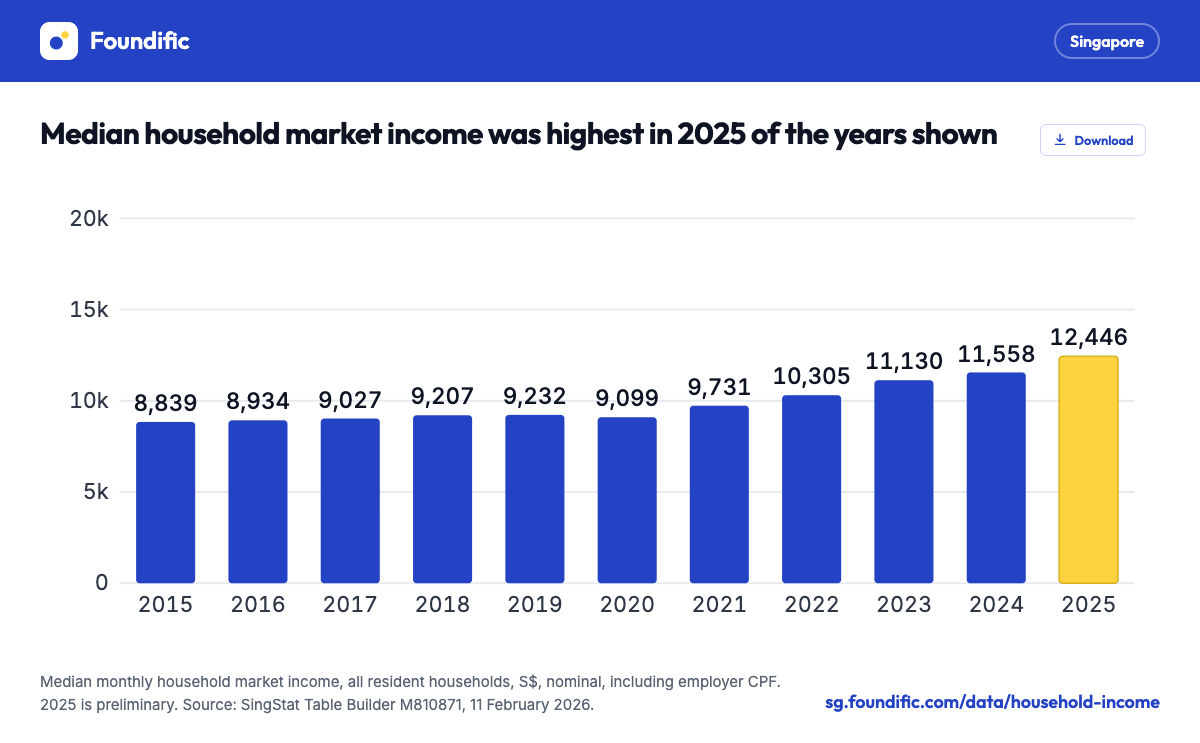
| Median household income, all resident households (monthly, nominal) | S$11,130 | S$11,558 | S$12,446 |
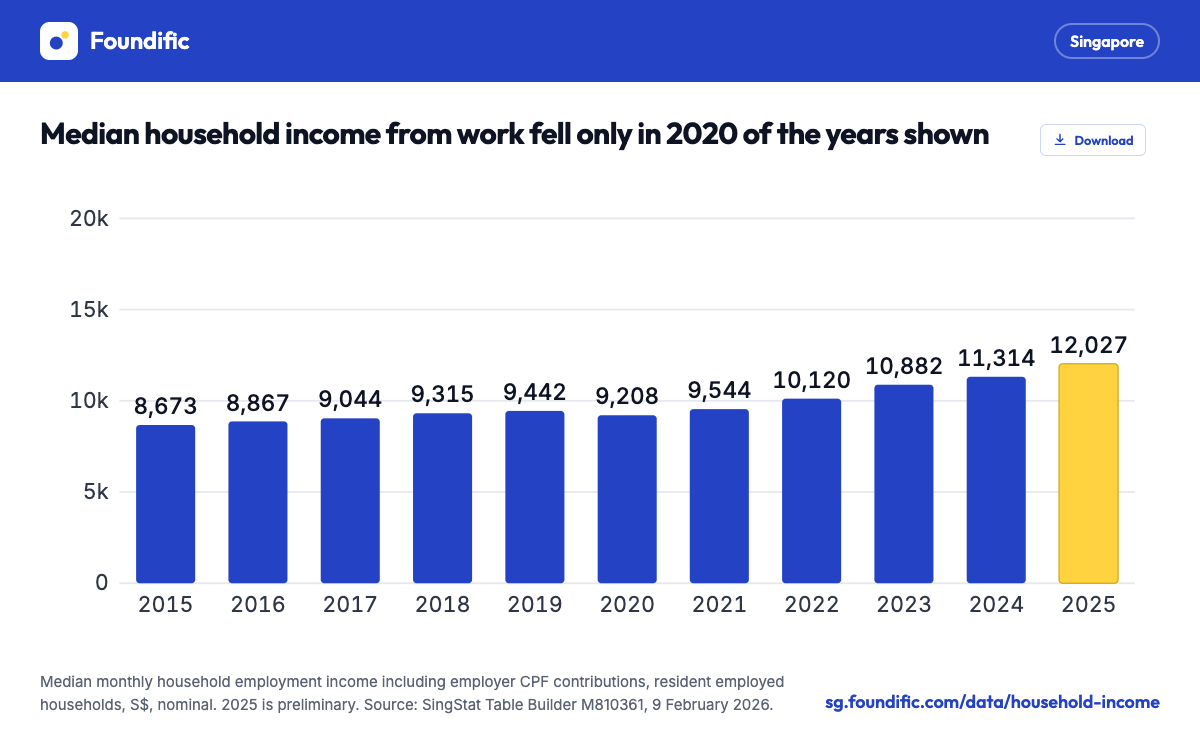
| Median income from work, resident employed households (monthly, nominal) | S$10,882 | S$11,314 | S$12,027 |
| Median market income per household member, all resident households (monthly) | S$3,699 | S$3,837 | S$4,160 |
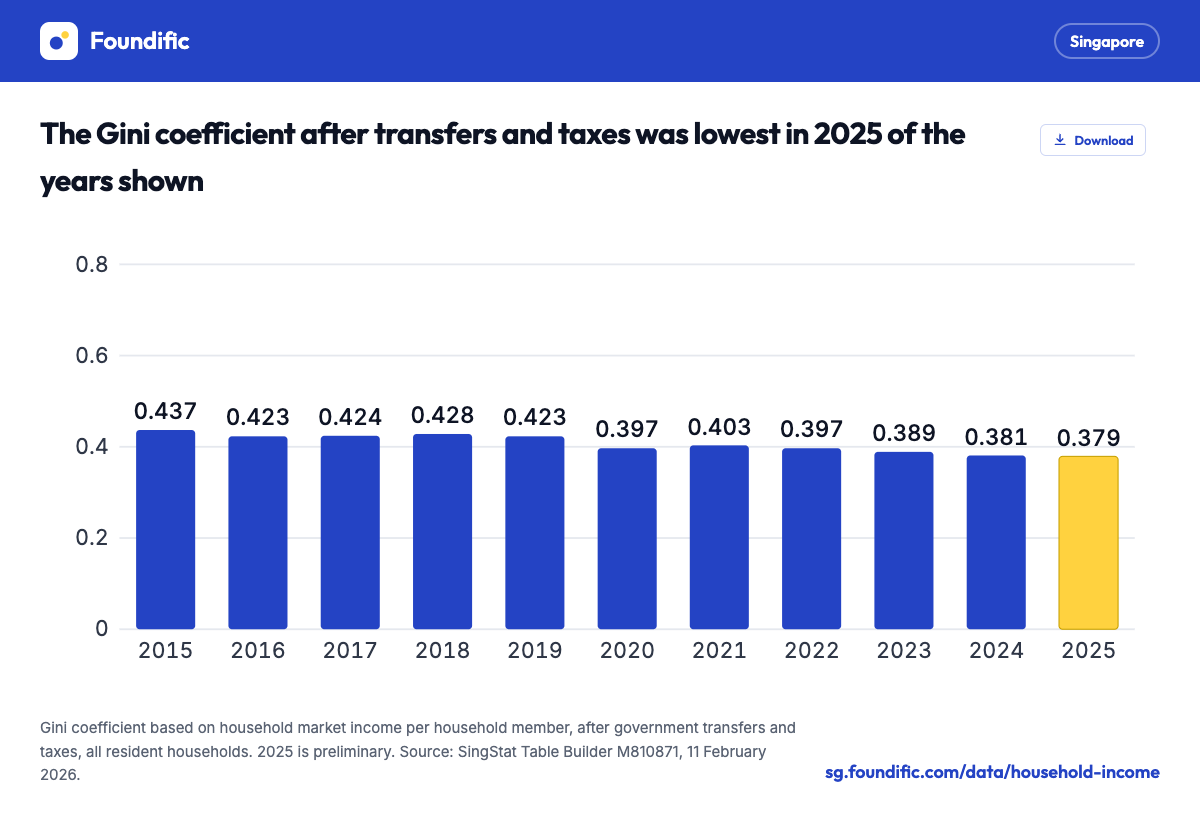
| Gini coefficient after transfers and taxes | 0.389 | 0.381 | 0.379 |
- S$12,446 median monthly household income in 2025, among all resident households, up from S$11,558 in 2024.
- 6.8% real growth in the median in 2025, after inflation, and 7.7% before.
- S$12,027 median income from work among resident employed households, including employer CPF, against S$11,314 in 2024.
- S$4,160 median income per household member in 2025, up 7.5% in real terms.
- 0.452 Gini coefficient before government transfers and taxes, and 0.379 after, both the lowest since the series began in 2015.
How much do Singapore households earn?
The median resident household earned S$12,446 a month in 2025, before government transfers and taxes. Half of households earned more and half earned less.
From the 2025 report, SingStat's headline measure is "market income" for all resident households. Earlier reports used the income from work of households with at least one employed person.
- Market income adds income from investments, rent, pensions, annuities and regular CPF payouts to income from work.
- Both measures include employer CPF contributions and one-twelfth of yearly bonuses.
- SingStat still publishes the income from work series, which goes back to 2000.
The average monthly household market income was S$16,159 in 2025, against S$15,303 in 2024. The average is higher than the median.
Growth before and after inflation
SingStat removes inflation using the Consumer Price Index (CPI) for the relevant household income group.
| Change, 2024 to 2025 | Nominal | Real |
|---|---|---|
| Median household market income | 7.7% | 6.8% |
| Median market income per household member | 8.4% | 7.5% |
| Average market income per household member | 6.9% | 5.9% |
| Median income from work, employed households | 6.3% | 5.4% |
| Median income from work per household member | 8.0% | 7.0% |
The two nominal changes for income from work are Foundific calculations from SingStat's dollar figures.
Over longer periods, the median household market income grew as follows.
- From 2015 to 2025 it rose 40.8% in nominal terms and 19.5% in real terms.
- From 2015 to 2020 the real rise was 2.2%, or 0.4% a year.
- From 2020 to 2025 the real rise was 17.0%, or 3.2% a year.
- The 6.8% real rise in 2025 was the largest yearly rise in the market income series, which starts in 2015.
Household income since 2015
The market income median fell once in these years, from S$9,232 in 2019 to S$9,099 in 2020. It has risen every year since.
The income from work series covers households with at least one employed person.
- The median was S$4,400 in 2000 and S$12,027 in 2025.
- Real growth was 5.4% in 2025, the largest since 5.5% in 2011.
- Real growth was 1.4% in 2024 and 2.7% in 2023.
Income by decile
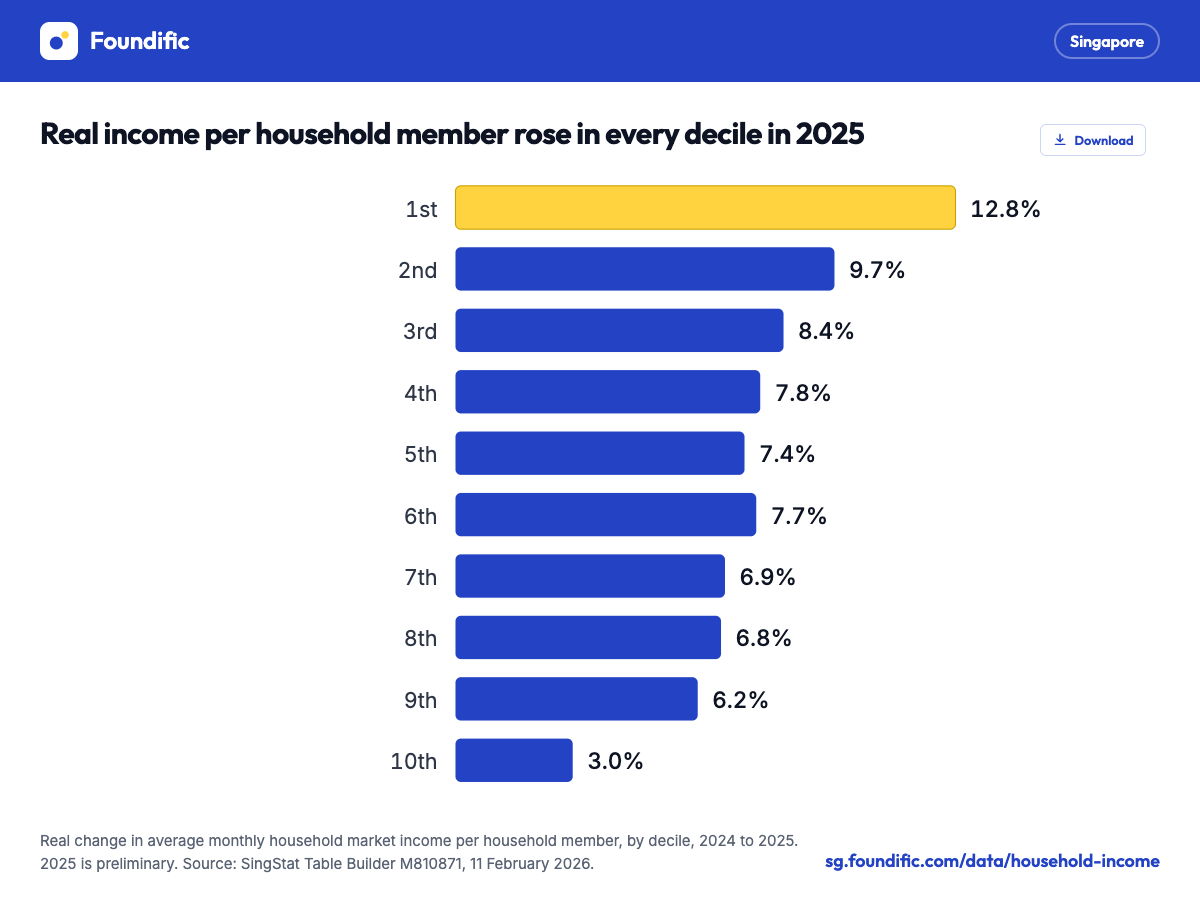
SingStat ranks all resident households by market income per household member and splits them into ten equal groups, called deciles.
| Average monthly income per household member | 2024 | 2025 | Nominal change | Real change |
|---|---|---|---|---|
| 1st decile (lowest) | S$446 | S$506 | 13.5% | 12.8% |
| 2nd decile | S$1,314 | S$1,450 | 10.4% | 9.7% |
| 3rd decile | S$2,066 | S$2,259 | 9.3% | 8.4% |
| 4th decile | S$2,739 | S$2,977 | 8.7% | 7.8% |
| 5th decile | S$3,458 | S$3,745 | 8.3% | 7.4% |
| 6th decile | S$4,262 | S$4,629 | 8.6% | 7.7% |
| 7th decile | S$5,261 | S$5,672 | 7.8% | 6.9% |
| 8th decile | S$6,595 | S$7,105 | 7.7% | 6.8% |
| 9th decile | S$8,833 | S$9,488 | 7.4% | 6.2% |
| 10th decile (highest) | S$17,232 | S$17,958 | 4.2% | 3.0% |
From 2020 to 2025, real average market income per household member rose by 1.4% to 10.5% a year across deciles, faster in the lower ones.
Households in the lowest decile relied mainly on income other than work in 2025.
- 49.3% of them were made up only of non-employed people aged 65 and over.
- Investment income, mostly interest on CPF balances, made up 40.9% of its income.
- Other income, mostly CPF retirement payouts, made up 37.0%.
Households move between deciles from year to year, so each decile is not always the same group of households.
Where household income comes from
Income from work made up most household market income in 2025. Its share fell from 85.1% in 2015 to 79.6% in 2025.
| Share of market income per household member | 2015 | 2024 | 2025 |
|---|---|---|---|
| Employment income | 85.1% | 81.1% | 79.6% |
| Investment income | 10.2% | 12.1% | 13.5% |
| Rental income | 3.8% | 4.1% | 4.0% |
| Other income | 0.9% | 2.7% | 3.0% |
- In 2025, 85.8% of resident households had at least one employed person.
- Households made up only of non-employed people aged 65 and over rose from 5.3% of resident households in 2015 to 9.2% in 2025.
Income inequality: the Gini coefficient
The Gini coefficient is 0 when every household has the same income and 1 when one household has all of it.
| Gini, per household member | 2015 | 2020 | 2024 | 2025 |
|---|---|---|---|---|
| Market income, before transfers and taxes | 0.494 | 0.479 | 0.460 | 0.452 |
| Market income, after transfers and taxes | 0.437 | 0.397 | 0.381 | 0.379 |
| Income from work, employed households, before | 0.463 | 0.452 | 0.435 | 0.426 |
| Income from work, employed households, after | 0.409 | 0.375 | 0.364 | 0.359 |
- Transfers and taxes lowered the 2025 Gini coefficient by 0.073.
- On the income from work measure, 0.426 before and 0.359 after were the lowest since that series began in 2000.
- On the modified OECD scale used by Eurostat, the 2025 Gini would be 0.439 before transfers and taxes and 0.368 after.
Government transfers and taxes
Resident households received an average of S$7,300 per household member in government transfers in 2025, against S$7,725 in 2024. These are yearly amounts.
- Regular contributions, such as Workfare Income Supplement and GST Vouchers, were S$1,891.
- One-off contributions, such as CDC Vouchers, were S$964, down from S$1,861 in 2024.
- Subsidised services such as education and healthcare were worth S$4,445.
- Households in HDB 1- and 2-room flats received an average of S$16,519 per member.
SingStat linked the fall to the end of one-off 2024 schemes, such as the Majulah Package MediSave Bonus and the Cost-of-Living Special Payment.
The first seven deciles received more in transfers than they paid in taxes in 2025. Per household member a year, on average, the lowest decile received S$14,683 and paid S$1,597; the highest received S$2,707 and paid S$27,217.
What the figures mean for households
To compare your household with the median, add up the monthly income of everyone in it: the people you live with and share food or other living arrangements with.
- Count each worker's gross pay plus employer CPF contributions and one-twelfth of any yearly bonus.
- Add regular rent, interest, dividends, pensions and CPF payouts.
- Leave out government transfers, such as GST Vouchers and CDC Vouchers.
- Divide by the number of people in the household to compare with the S$4,160 median per member.
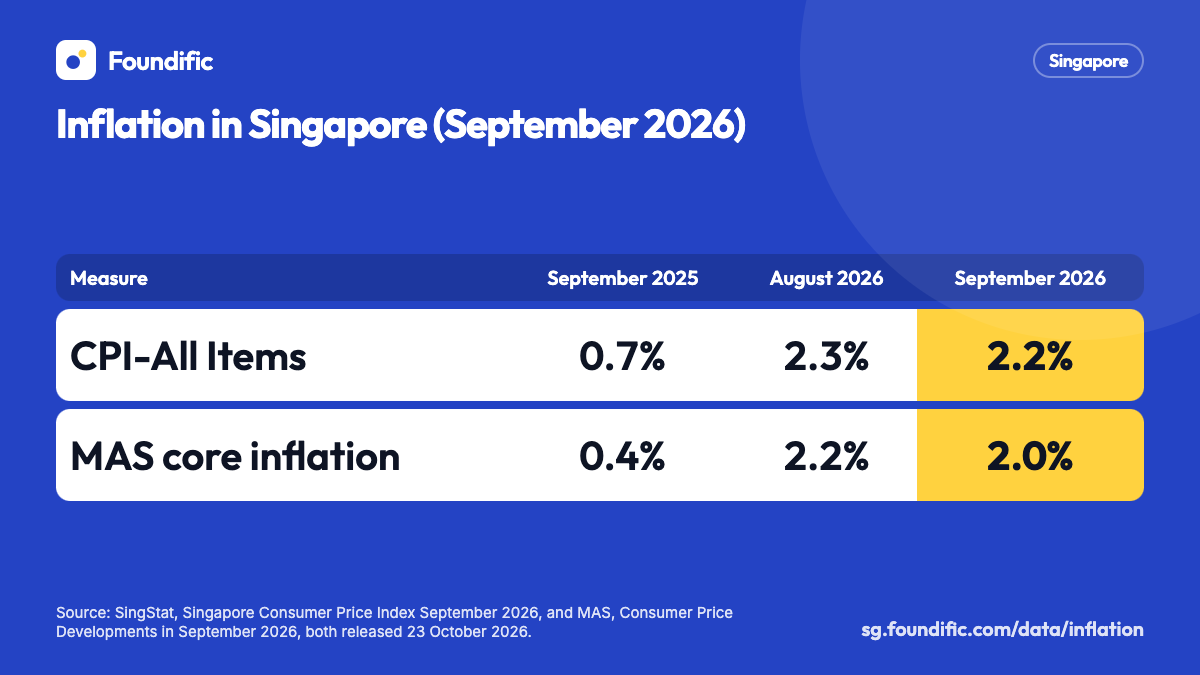
Household figures add up every earner in the household. For individual pay, see wage growth or the salary comparison. Price rises are on the inflation page.
How SingStat measures household income
- A resident household is one whose reference person is a Singapore citizen or permanent resident.
- Market income is income from work plus investment, rental and other regular income, before transfers and taxes.
- Income from work includes employer CPF contributions and one-twelfth of yearly bonuses.
- Property sale proceeds, share trading gains, windfalls, lump-sum CPF withdrawals and drawing down savings are excluded.
- The income from work series covers resident employed households and excludes the pay of live-in domestic workers.
- Real changes for the median use the CPI for the middle 60% of households; for deciles, the CPI for the lowest 20%, middle 60% or highest 20%; for the overall average, the all-items CPI.
- Of 33,000 housing units sampled for the June Comprehensive Labour Force Survey 2025, 27,324 households responded, a rate of 86.8%.
Release calendar
SingStat releases household income figures once a year. The 2025 figures were released on 9 February 2026.
- Household Income, 2026 is due not later than 28 February 2027, according to SingStat's Advance Release Calendar read on 24 October 2026.
Questions
What is the median household income in Singapore?
The median monthly household market income was S$12,446 in 2025, across all resident households, before government transfers and taxes. Among households with at least one employed person, the median income from work was S$12,027. Both include employer CPF contributions.
Does household income include employer CPF?
Yes. SingStat counts employer CPF contributions and one-twelfth of yearly bonuses as part of income from work. The figures are before income tax and other taxes.
Why did the median household income change from earlier reports?
From the 2025 report, SingStat measures market income across all resident households, including those with no employed person. Earlier reports measured income from work among employed households only. Both series are on SingStat Table Builder.
What is Singapore's Gini coefficient?
In 2025 it was 0.452 before government transfers and taxes and 0.379 after, per household member. Both were the lowest since the market income series began in 2015.
When is the next household income release?
SingStat's calendar lists Household Income, 2026 for release not later than 28 February 2027.
Related guides
Sources
SingStat Key Household Income Trends 2025 (paper and press release), Table Builder M810871, M810361 and C030001 to C030036, and the SingStat release calendar
- SingStat, Key Household Income Trends, 2025 Released 9 February 2026. Definitions, Charts 1 to 11, income sources by decile, transfers and taxes, survey response. 2025 figures are preliminary.
- SingStat, Key Household Income Trends, 2025, press release Released 9 February 2026. Headline figures and the change from employment income to market income.
- SingStat Table Builder M810871: Key Indicators On Household Market Income Among Resident Households Data last updated 11 February 2026. Median, per-member and decile market income, real changes and Gini coefficients, 2015 to 2025.
- SingStat Table Builder M810361: Key Indicators On Household Employment Income Among Resident Employed Households Data last updated 9 February 2026. Median household employment income including employer CPF, real changes and Gini coefficients, 2000 to 2025.
- SingStat Table Builder C030004 to C030007, C030036 and C030001 Released 9 February 2026 (C030036 updated 14 August 2026). Average market income, nominal and cumulative changes, redistributive impact and transfers by type.
- SingStat, Advance Release Calendar Read 24 October 2026. Household Income, 2026, due not later than 28 February 2027.