The Ministry of Manpower (MOM) publishes the median income of resident women and men working full-time each year. The latest figures are for June 2025 and were released on 29 January 2026.
Gender pay gap at a glance
| Full-time employed residents | 2015 | 2020 | 2024 | 2025 |
|---|---|---|---|---|
| Men, median a month | S$4,118 | S$4,719 | S$5,850 | S$6,000 |
| Women, median a month | S$3,744 | S$4,374 | S$5,265 | S$5,460 |
| Gap between medians | 9.1% | 7.3% | 10.0% | 9.0% |
- S$6,000 a month for men among full-time employed residents, median gross income including employer CPF, June 2025.
- S$5,460 a month for women among full-time employed residents, S$540 less than men.
- 9.0% gap between the two medians in 2025, a Foundific calculation from MOM's figures.
- 14.3% unadjusted gap in MOM's own measure for full-time resident employees aged 25 to 54, 2023.
- 6.0% adjusted gap in 2023, after MOM accounted for age, education, occupation, industry and hours worked.
How large is the gender pay gap in Singapore?
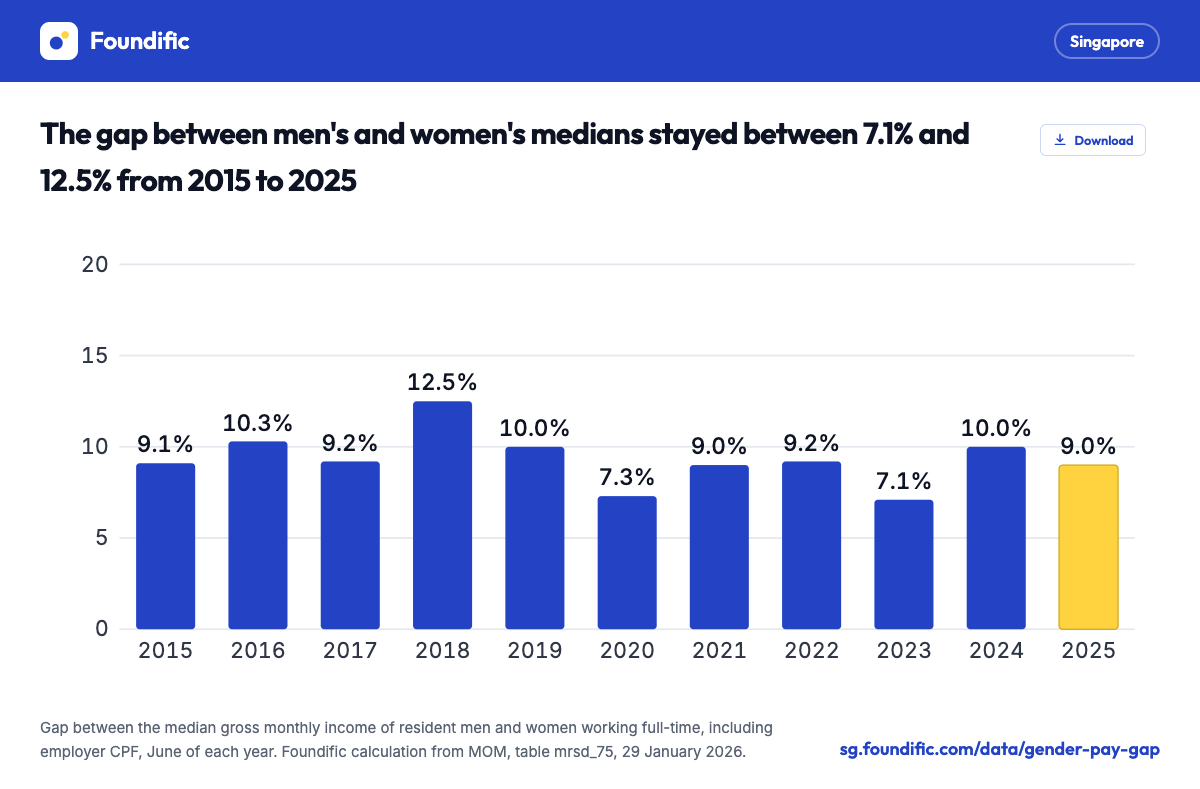
Resident women working full-time had a median income 9.0% below men's in June 2025. The gap was 9.1% in 2015 and 10.0% in 2024.
The figures are gross monthly income from work, including employer CPF, in June of each year. The gap is our calculation: one minus women's median divided by men's.
- Excluding employer CPF, the medians were S$5,250 for men and S$4,776 for women in 2025, also a 9.0% gap.
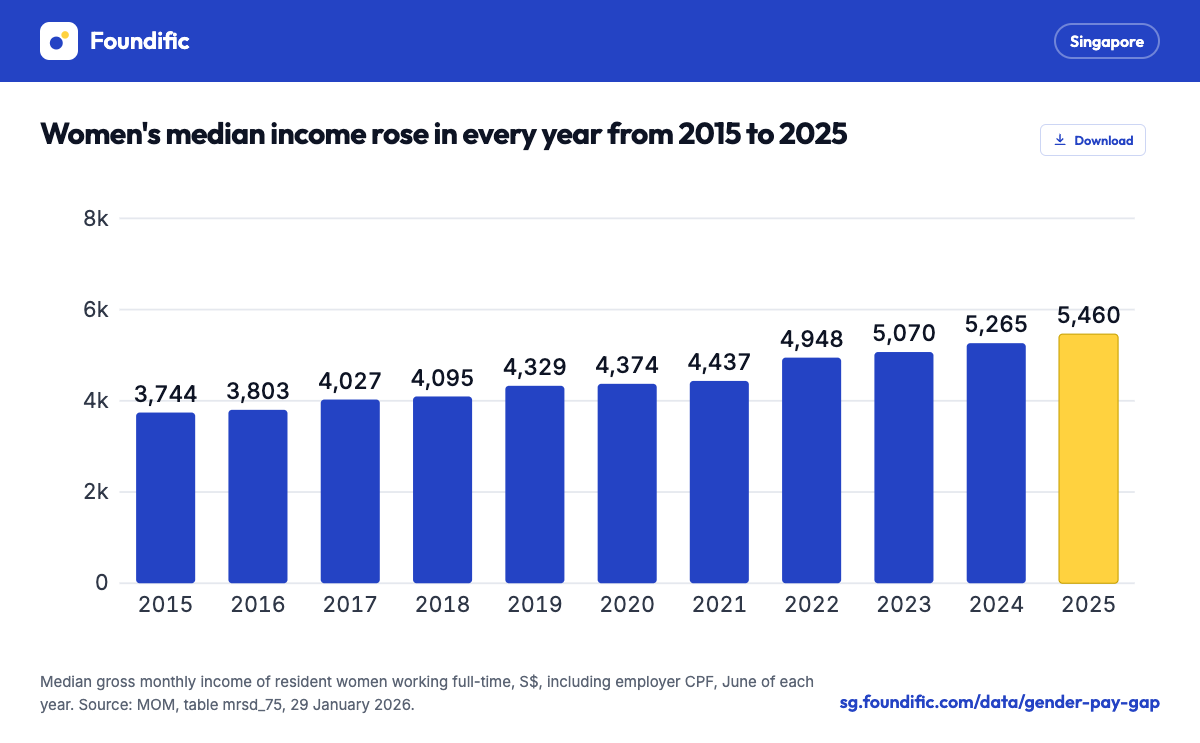
- Women's median rose by 45.8% from 2015 to 2025, and men's by 45.7%.
- MOM's own measure covers a narrower group. In 2018 and 2023, it gave 16.3% and 14.3%, against 12.5% and 7.1% for all full-time employed residents. It is set out below.
The gap since 2015
Both medians come from a sample survey, so year-to-year changes in the gap should be read with caution. MOM advises reading income changes over 5 or 10 years.
| Year | Men | Women | Gap |
|---|---|---|---|
| 2015 | S$4,118 | S$3,744 | 9.1% |
| 2016 | S$4,241 | S$3,803 | 10.3% |
| 2017 | S$4,437 | S$4,027 | 9.2% |
| 2018 | S$4,680 | S$4,095 | 12.5% |
| 2019 | S$4,810 | S$4,329 | 10.0% |
| 2020 | S$4,719 | S$4,374 | 7.3% |
| 2021 | S$4,875 | S$4,437 | 9.0% |
| 2022 | S$5,450 | S$4,948 | 9.2% |
| 2023 | S$5,460 | S$5,070 | 7.1% |
| 2024 | S$5,850 | S$5,265 | 10.0% |
| 2025 | S$6,000 | S$5,460 | 9.0% |
Pay gap by age
The gap was widest for workers aged 50 to 59, at 19.3% in 2025. Women under 30 had a higher median than men under 30.
| Age group | Men | Women | Gap 2025 | Gap 2015 |
|---|---|---|---|---|
| Below 30 | S$4,157 | S$4,453 | Women 7.1% higher | Women 0.8% higher |
| 30 to 39 | S$7,009 | S$6,411 | 8.5% | 11.4% |
| 40 to 49 | S$8,549 | S$7,020 | 17.9% | 22.2% |
| 50 to 59 | S$6,528 | S$5,265 | 19.3% | 17.6% |
| 60 and over | S$3,358 | S$2,940 | 12.4% | 19.3% |
- Women under 30 had a median S$296 above men under 30 in 2025.
- The gap in money terms was largest at ages 40 to 49, at S$1,529 a month.
- At ages 50 to 59 it was S$1,263.
- The gap narrowed from 2015 to 2025 in every age group from 30 upwards, except 50 to 59.
Medians by age are from MOM table mrsd_75, including employer CPF. Gaps are Foundific calculations.
Pay gap by occupation
Among PMETs, women's median was 14.8% below men's in 2025. PMET stands for professionals, managers, executives and technicians.
| Occupation group, 2025 | Men | Women | Gap |
|---|---|---|---|
| PMETs | S$8,239 | S$7,020 | 14.8% |
| Managers and administrators, including working proprietors | S$11,945 | S$11,136 | 6.8% |
| Professionals | S$9,380 | S$8,190 | 12.7% |
| Associate professionals and technicians | S$4,906 | S$4,817 | 1.8% |
| Non-PMETs | S$3,145 | S$3,042 | 3.3% |
| Clerical support workers | S$3,379 | S$3,525 | Women 4.3% higher |
| Service and sales workers | S$3,510 | S$3,070 | 12.5% |
| Craftsmen and related trades workers | S$3,360 | S$2,828 | 15.8% |
| Plant and machine operators and assemblers | S$3,000 | S$2,538 | 15.4% |
| Cleaners, labourers and related workers | S$2,307 | S$2,184 | 5.3% |
Each group covers many jobs. MOM's 2020 paper found that comparing men and women in the same broad occupation group lowered the 2018 gap from 12.5% to 9.7%.
- The PMET gap was S$1,219 a month.
- The PMET gap is larger than the gap in each of its three parts.
- Clerical support was the only group shown where women's median was above men's.
Source: MOM, table mrsd_37, including employer CPF. Gaps are Foundific calculations. Pay for single jobs is in the salary guides by occupation.
MOM's unadjusted and adjusted gender pay gap
MOM's adjusted gender pay gap was 6.0% in 2023, against an unadjusted gap of 14.3%. MOM's 2020 paper and 2024 update give the adjusted gap for 2002, 2018 and 2023.
| MOM measure, full-time resident employees aged 25 to 54 | 2002 | 2018 | 2023 |
|---|---|---|---|
| Unadjusted gap | 16.0% | 16.3% | 14.3% |
| Adjusted gap, 2020 paper | 8.8% | 6.0% | n.a. |
| Adjusted gap, revised model | n.a. | 6.7% | 6.0% |
For its 2024 update MOM revised the model to use the SSOC 2020 occupation codes. On that model the 2018 adjusted gap is 6.7%, so the fall to 2023 was 0.7 percentage points.
- The unadjusted gap fell by 2.0 percentage points from 2018 to 2023.
- In its 2020 paper MOM compared the 2018 adjusted gap with studies for the United States (8.0%) and Canada (7.7% to 8.3%).
- MOM's 2020 paper put the 2018 gap for all full-time employed residents at 12.5%, the same as our calculation.
How MOM breaks down the gap
MOM splits the 14.3% unadjusted gap of 2023 into parts linked to measured differences between men and women.
| Part of the 2023 gap | Percentage points |
|---|---|
| Occupation | 6.1 |
| Industry | 1.4 |
| Usual hours worked | 0.6 |
| Age and education | 0.2 |
| Not explained by these factors (adjusted gap) | 6.0 |
- Labour market factors (occupation, industry and hours) together accounted for 8.1 points.
- In MOM's 2020 paper, on the earlier model, occupation accounted for 7.0 points of the 2018 gap and age and education for 1.9 points.
- MOM said the gap narrowed from 2018 to 2023 as the occupational profile of women improved more than that of men.
MOM's infographic shows the occupational profile of full-time resident employees aged 25 to 54, as a share of each sex.
| Share in each group | Men 2018 | Men 2023 | Women 2018 | Women 2023 |
|---|---|---|---|---|
| PMETs | 73.1% | 79.4% | 66.2% | 75.0% |
| Clerical, sales and service workers | 13.1% | 11.0% | 27.9% | 21.3% |
| Craftsmen, operators, cleaners, labourers and other workers | 13.9% | 9.5% | 5.9% | 3.7% |
MOM's 2020 paper says the remaining gap may reflect factors the model could not measure. It names type of firm, position within the firm, work experience, caregiving responsibilities, parenthood and labour market discrimination.
How the gap is measured
Both measures compare medians, the income of the person in the middle when incomes are ranked.
- The unadjusted gap is one minus women's median divided by men's median, in per cent.
- The adjusted gap compares men and women with the same age, education, occupation, industry and usual hours worked.
- MOM estimates it with an Oaxaca-Blinder decomposition. The part of the gap these factors do not explain is the adjusted gap.
- MOM's study covers full-time resident employees aged 25 to 54, to compare people with similar attachment to work.
- The yearly MOM tables on this page cover all full-time employed residents aged 15 and over, including the self-employed, so their gap differs from MOM's.
The yearly figures come from the Comprehensive Labour Force Survey.
- Residents are Singapore Citizens and permanent residents. Full-time National Servicemen are excluded.
- Full-time work means at least 35 normal hours a week.
- Gross monthly income includes basic pay, overtime, commissions, allowances and one-twelfth of annual bonuses, before employee CPF and tax.
- The 2025 sample was 33,000 dwelling units. The reference month is June.
Release calendar
- Labour Force in Singapore 2026 is provisionally scheduled for 25 to 29 January 2027. The 2025 edition carried incomes by sex.
- MOM's release calendar does not list an update of the adjusted gap.
Questions
What is the gender pay gap in Singapore?
In MOM's own measure, women who were full-time resident employees aged 25 to 54 had a median income 14.3% below men's in 2023. For all full-time employed residents in June 2025, the medians were S$6,000 for men and S$5,460 for women.
What is the adjusted gender pay gap?
It compares men and women with the same age, education, occupation, industry and hours worked. MOM put it at 6.0% in 2023. The remaining gap is what those factors do not explain.
Why is the adjusted gap smaller than the unadjusted gap?
More than half of the unadjusted gap is linked to labour market factors: occupation, industry and hours worked. In 2023 occupation accounted for 6.1 percentage points of the 14.3% gap, and industry for 1.4 points.
When will new figures be released?
MOM's Labour Force in Singapore 2026 report, provisionally scheduled for 25 to 29 January 2027, is expected to carry June 2026 incomes by sex. MOM's release calendar does not list an update of the adjusted gap.
Compare your own pay
To see where a salary sits for your job and age, use the salary comparison. Pay growth for all workers is on the wage growth page.
Related guides
Sources
MOM income time series mrsd_75 and mrsd_37, Labour Force in Singapore 2025, and MOM's adjusted gender pay gap paper (2020) and update (2024)
- MOM, Statistical Table: Income (tables mrsd_75 and mrsd_37) Released 29 January 2026. Median gross monthly income of full-time employed residents by sex and age (mrsd_75) and by sex and occupation (mrsd_37), to June 2025.
- MOM, Labour Force in Singapore 2025 Released 29 January 2026. Table C1 (median income by sex, 2015 to 2025), labour force participation by sex, and coverage and methodology.
- MOM, Infographic: Update on Singapore's Adjusted Gender Pay Gap Released 3 April 2024. Unadjusted and adjusted gaps for 2023, the decomposition of the gap, and the occupational profile of men and women in 2018 and 2023.
- MOM and NUS, Singapore's Adjusted Gender Pay Gap (occasional paper) Released 9 January 2020. Method, the 2018 unadjusted and adjusted gaps, and the adjusted gap for 2002.
- MOM, Written Answer to PQ on Gender Pay Gap 2 April 2024. The 2023 figures and the factors MOM lists behind the gap.
- MOM, Labour Market Report, Second Quarter 2026 Released 21 September 2026. Release calendar for the Labour Force in Singapore reports.