The Ministry of Manpower (MOM) counts residents who work part-time and want more hours. The latest yearly figures are for June 2025, released on 29 January 2026, and the latest quarterly rate is for Q2 2026.
Underemployment at a glance
| Residents aged 15 and over | 2015 | 2020 | 2024 | 2025 |
|---|---|---|---|---|
| Underemployment rate | 2.9% | 4.1% | 2.3% | 1.9% |
| Underemployed residents | 62,600 | 92,100 | 55,200 | 45,300 |
| Rate for women | 3.9% | 5.0% | 2.9% | 2.3% |
| Rate for men | 2.1% | 3.4% | 1.8% | 1.5% |
- 1.9% time-related underemployment rate for residents in 2025, down from 2.3% in 2023 and 2024.
- 45,300 underemployed residents in 2025, 9,900 fewer than in 2024.
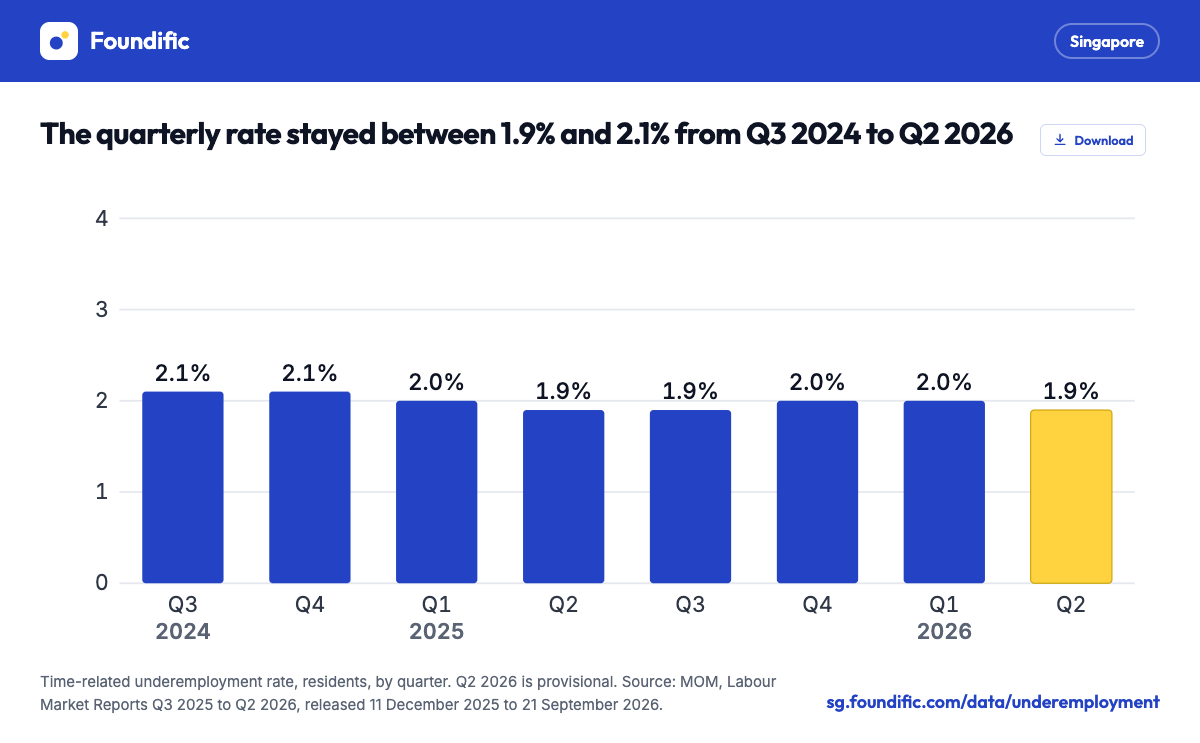
- 1.9% in Q2 2026, a provisional quarterly rate, against 2.0% in Q1 2026.
- 2.3% for women and 1.5% for men in 2025.
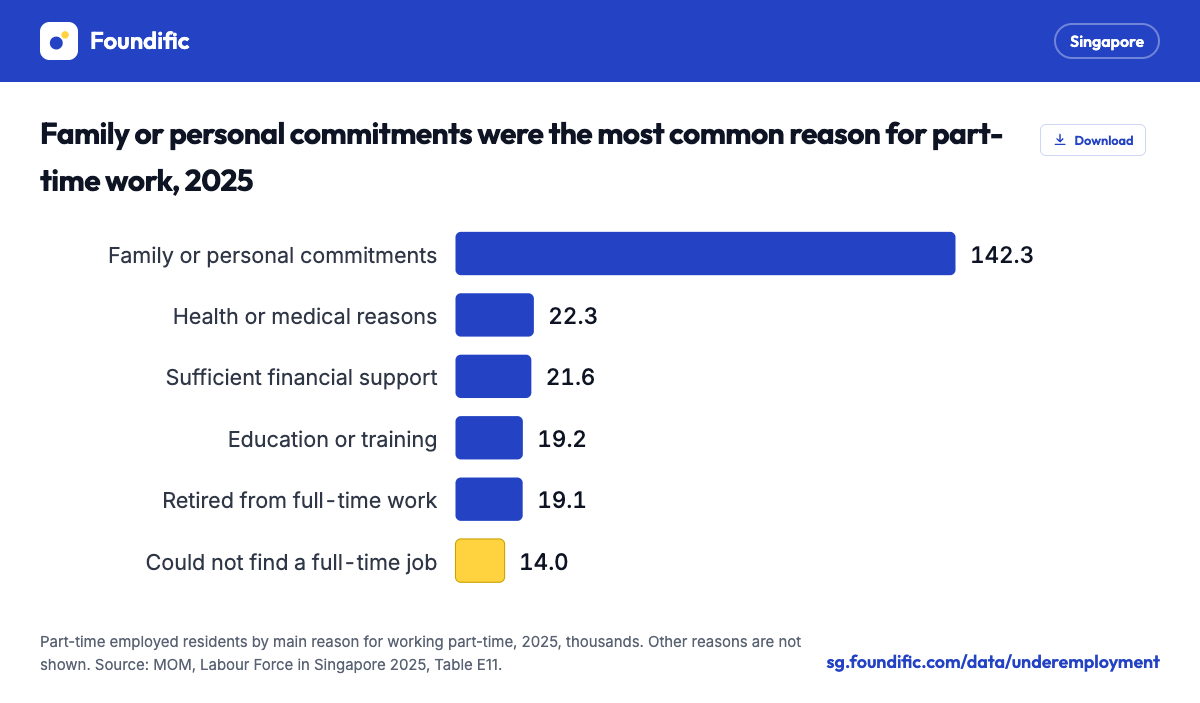
- 14,000 part-timers worked part-time mainly because they could not find a full-time job, 5.9% of all part-time residents.
How many residents are underemployed?
1.9% of employed residents were in time-related underemployment in 2025, or 45,300 people. MOM says the rate is the lowest in its comparable series, which starts in 2009.
The rate fell by 0.4 percentage points in 2025, after two years at 2.3%.
- The 2025 count was 17,300 lower than in 2015.
- It was 46,800 lower than in 2020.
- MOM said the fall from 2024 and from a decade ago was largely broad-based across most age and education groups, especially among seniors and the less educated.
Underemployment since 2015
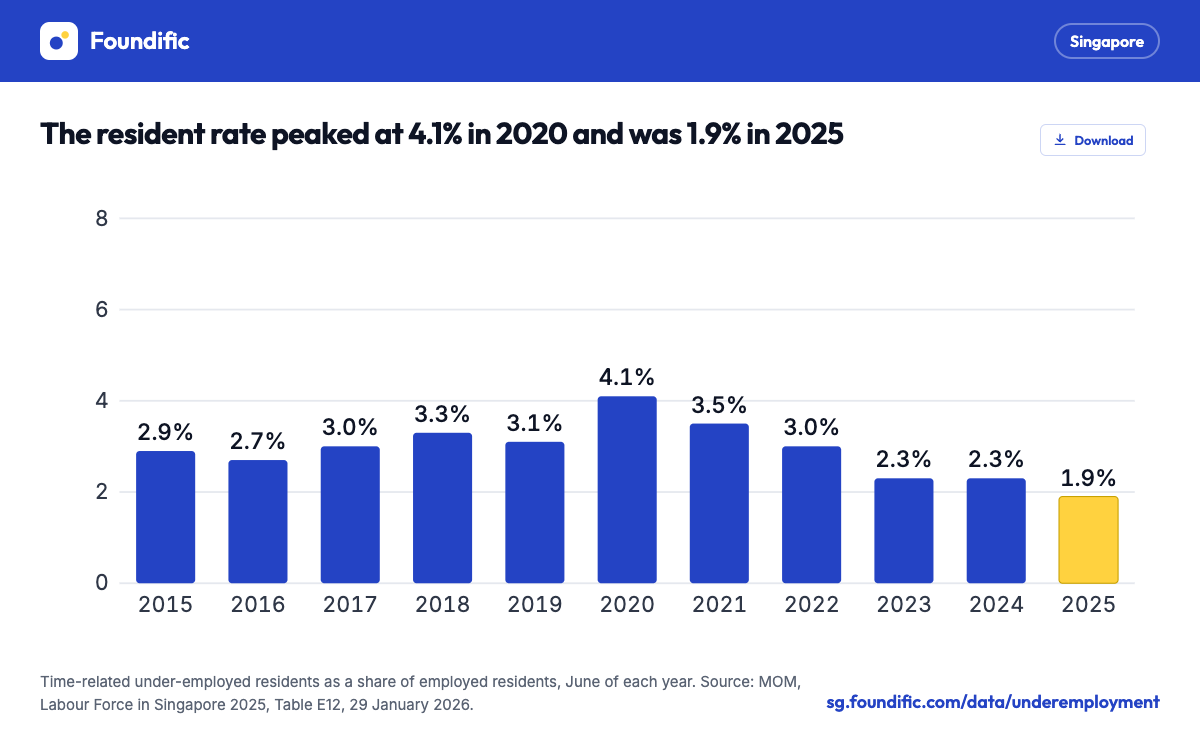
The rate stayed between 2.7% and 3.3% from 2015 to 2019. It rose to 4.1% in 2020, the highest year in Table E12, when 92,100 residents were underemployed.
- The rate fell each year from 2020 to 2023.
- It was 2.3% in both 2023 and 2024.
- In 2025 it was 1.0 percentage point below the 2015 rate.
Quarterly underemployment rate
MOM also gives a quarterly rate in the footnotes of its Labour Market Report. These come from MOM's monthly Labour Force Survey.
- MOM described the Q2 2026 rate of 1.9% as comparable to Q1 2026 (2.0%) and to Q2 2025 (1.9%).
- The Q2 2026 figure is provisional and may be revised.
The unemployment rate page covers the monthly and quarterly unemployment figures from the same reports.
Underemployment by sex
Women made up 57.6% of underemployed residents in 2025, with 26,100 people. Their rate was 2.3%, against 1.5% for men.
Women's rate has been above men's in every year from 2015 to 2025 in Table E12.
- 19,200 men were underemployed in 2025, down from 22,500 in 2024.
- 26,100 women were underemployed, down from 32,800.
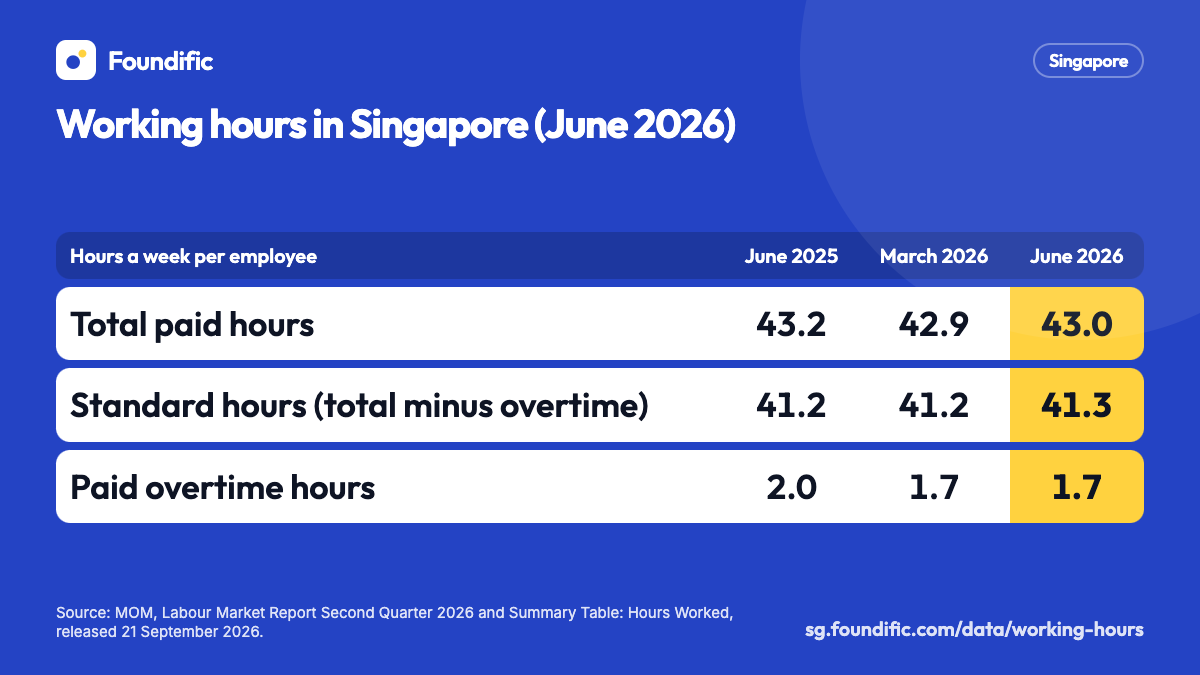
- Women were 62.9% of part-time employed residents in 2025, so more of them work under 35 hours a week.
Underemployment by age
Residents aged 15 to 24 had the highest rate in 2025, at 3.7%. The lowest was 0.9%, for those aged 30 to 39.
| Age group | Rate, 2024 | Rate, 2025 | Underemployed, 2025 |
|---|---|---|---|
| 15 to 24 | 3.8% | 3.7% | 4,600 |
| 25 to 29 | 1.2% | 1.8% | 3,400 |
| 30 to 39 | 1.4% | 0.9% | 5,100 |
| 40 to 49 | 1.8% | 1.3% | 7,200 |
| 50 to 59 | 2.6% | 2.5% | 12,100 |
| 60 and over | 3.9% | 2.8% | 12,800 |
Older residents made up most of the count. 24,900 of the 45,300 underemployed residents were aged 50 or over.
- The rate for those aged 60 and over fell by 1.1 percentage points.
- The rate for those aged 25 to 29 rose by 0.6 percentage points, the only age group with a rise.
By occupation, industry and qualification
Non-PMET workers had a rate of 3.0% in 2025, against 1.3% for PMETs (professionals, managers, executives and technicians).
- Cleaners, labourers and related workers had a rate of 4.9%.
- Service and sales workers had 4.0%.
- Managers and administrators had 0.6%.
By industry, the 2025 rate was 4.6% in arts, entertainment and recreation and 4.2% in accommodation and food services. It was 0.9% in manufacturing.
By qualification, the rate was 3.0% for post-secondary (non-tertiary) holders, 2.8% for those below secondary and 1.4% for degree holders.
Why residents work part-time
MOM asks every part-time resident for the main reason they work part-time. In 2025 there were 239,300 part-time residents, 19,500 fewer than in 2024.
- 59.5% of part-timers gave family or personal commitments as the main reason.
- 14,000 said they could not find a full-time job: 7,300 men and 6,700 women.
- That group was 5.9% of part-timers in 2025, against 5.6% in 2024.
What the figures mean for part-time workers
Underemployment and involuntary part-time work measure different groups. A part-timer who chose part-time work for family reasons can still count as underemployed if they want more hours and can take them.
- 45,300 residents wanted and could take on more hours in 2025.
- That was 18.9% of all part-time residents (Foundific calculation, since the underemployed work under 35 hours a week).
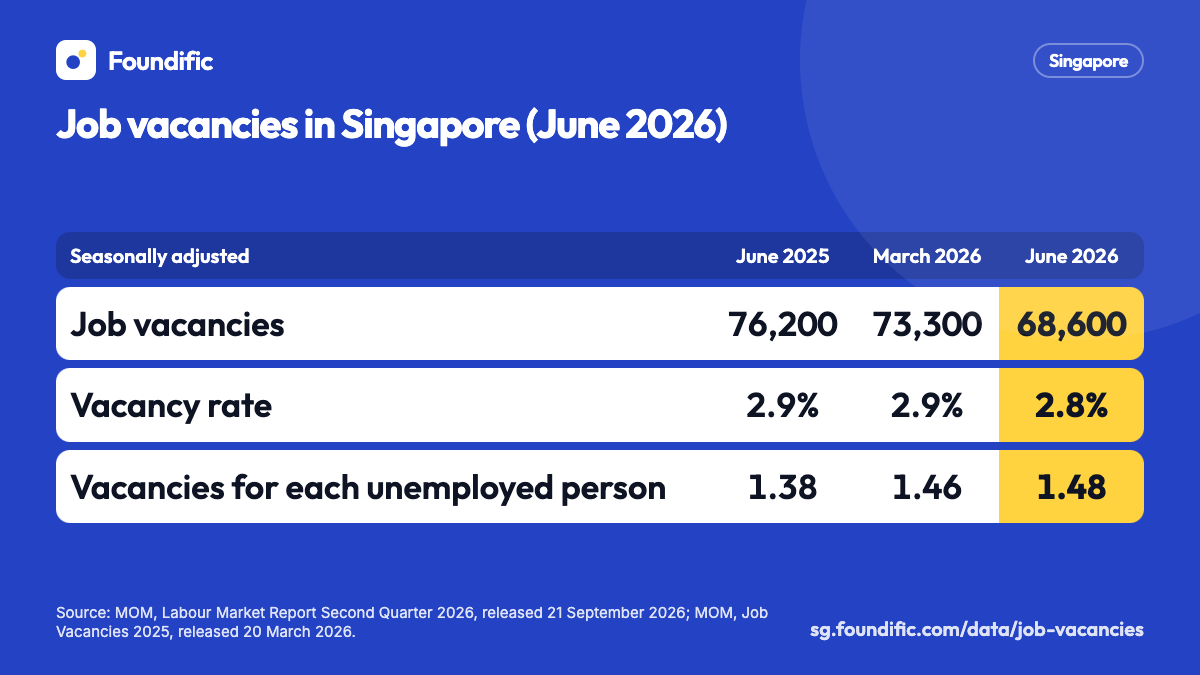
If you work part-time and want more hours, the vacancy figures show where employers are hiring. See job vacancies in Singapore. Pay trends are on the wage growth page, and the share of residents in work is on the labour force participation page.
How MOM measures underemployment
- A time-related under-employed person is aged 15 or over, normally works less than 35 hours a week, and is willing and available to work more.
- The rate is the number of time-related under-employed persons as a share of all employed persons.
- Part-time means normal hours of work below 35 a week. Before 2009 the threshold was 30 hours; MOM changed it to match the Employment Act.
- The yearly figures come from the Comprehensive Labour Force Survey, run each year since 1974, with a sample of 33,000 households.
- Fieldwork for 2025 ran from 3 March 2025 to 31 July 2025, and results were grossed up to the resident population in June 2025.
- The survey covers residents in private households. Workers in dormitories and worksites are excluded.
- Residents are Singapore citizens and permanent residents.
- MOM writes quarters as "Q2 2026"; this page writes "Q2 2026".
Other measures of spare capacity in 2025 were the resident unemployment rate of 3.3% and 7,400 discouraged workers, 0.3% of the resident labour force.
Release calendar
MOM published the 2025 annual rate first in the Labour Force in Singapore Advance Release on 28 November 2025.
- The Labour Force in Singapore Advance Release 2026 is scheduled for 26 November to 2 December 2026.
- The Labour Market Report for Q3 2026, with the September quarter rate, is scheduled for 10 to 16 December 2026.
- The full Labour Force in Singapore 2026 report is scheduled for 25 to 29 January 2027.
- All three dates are provisional, from MOM's calendar of 21 September 2026.
Questions
What is the underemployment rate in Singapore?
MOM's time-related underemployment rate for residents was 1.9% in 2025, or 45,300 people. The provisional quarterly rate for Q2 2026 was also 1.9%. The figures were released on 29 January 2026 and 21 September 2026.
What does time-related underemployment mean?
It counts people aged 15 and over who normally work less than 35 hours a week and are willing and available to work more hours. The rate divides that number by all employed residents.
Is underemployment the same as involuntary part-time work?
No. Underemployment counts part-timers who want more hours, whatever their reason for working part-time. In 2025, 14,000 part-time residents said their main reason was that they could not find a full-time job.
When is the next underemployment figure released?
The Labour Force in Singapore Advance Release 2026 is scheduled for 26 November to 2 December 2026. The Labour Market Report for Q3 2026 follows from 10 to 16 December 2026.
Related guides
Sources
MOM Labour Force in Singapore 2025 and 2024 (Section E tables), Labour Force in Singapore Advance Release 2025, and the Labour Market Reports for Q3 2025 to Q2 2026
- MOM, Labour Force in Singapore 2025 Released 29 January 2026. Paragraphs 2.25 and 2.26, definitions, survey method, and Section E tables E6, E11, E12 and E13.
- MOM, Labour Force in Singapore 2024, Section E tables Released 27 January 2025. Tables E11 and E13: reasons for part-time work and underemployment by age, 2024.
- MOM, Labour Force in Singapore Advance Release 2025, press release Released 28 November 2025. First release of the 2025 annual rate.
- MOM, Labour Market Report, Second Quarter 2026 Released 21 September 2026. Footnote 4: Q2 2026 rate (provisional), Q1 2026 and Q2 2025; release calendar (page A29).
- MOM, Labour Market Reports, Third Quarter 2025 to First Quarter 2026 Released 11 December 2025 (Q3 2025), 20 March 2026 (Q4 2025) and 15 June 2026 (Q1 2026). Quarterly rates from Q3 2024 to Q1 2026, in the footnotes.