Graphic designer salary in Singapore
What the job is: Graphic designer conceptualises, develops and refines design solutions according to design briefs. Also called: Graphic artist, Advertising illustrator. SSOC 2024, 21661
- Graphic designer: S$4,225 median a month. Middle 50% earn S$3,200 to S$5,500.
- Multimedia designer, artist or animator: S$5,400 median, S$1,175 above a graphic designer.
- Design graduates: S$3,350 at NTU Art, Design and Media and S$3,675 at SIT Digital Communications and Integrated Media.
- By industry: S$5,600 in information and communications, S$2,188 in accommodation and food services.
- Employer size: S$4,888 at firms with 200 or more staff, against S$3,816 at firms with 25 to 199.
How much do graphic designers earn?
A graphic designer earns S$4,225 at the median. Multimedia designers, artists and animators earn S$5,400.
Gross monthly wage, June 2025, all industries.
| Occupation, all industries | Basic wage, median | Gross, 25th percentile | Gross, median | Gross, 75th percentile |
|---|---|---|---|---|
| Multimedia designer/artist/animatorPartial detail | 5,400 | 4,000 | 5,400 | 7,800 |
| Graphic designerFull detail | 4,188 | 3,200 | 4,225 | 5,500 |
Source cells (MOM spreadsheet)
T4!C179:I179, T4!C144:I144- Gross pay is close to basic: graphic designers' basic median is S$4,188, so allowances and overtime add little.
- Graphic designer pay has a wide range: S$2,300 between the 25th and 75th percentile.
- Multimedia designers create animation, special effects and video content (SSOC 2024). MOM has one year of figures for the job.
What affects pay most
For Graphic designer (SSOC 21661), industry makes the largest difference: S$5,600 (Information and Communications) against S$2,188 (Accommodation and Food Services), 156% more.
| What changes | Lowest | Median | Highest | Median | Highest vs lowest |
|---|---|---|---|---|---|
| Industry | Accommodation and Food Services | 2,188 | Information and Communications | 5,600 | 156% |
| Age | 25 to 29 | 3,875 | 50 to 59 | 5,241 | 35% |
| Firm size | 25 to 199 staff | 3,816 | 200 or more staff | 4,888 | 28% |
| Sex | Women | 4,180 | Men | 4,417 | 6% |
Starting salary for design graduates
Design graduates earned S$3,350 to S$3,675 at the median in 2025, depending on the course.
Graduates in full-time permanent jobs, surveyed on 1 November 2025.
| University and programme | Basic, median | Gross, median | Gross, mean | Gross, middle 50% |
|---|---|---|---|---|
| NTU, Art, Design and Media | 3,350 | 3,350 | 3,464 | 3,000 to 3,600 |
| SIT, Digital Communications and Integrated Media | 3,600 | 3,675 | 3,776 | 3,400 to 4,010 |
- NTU Art, Design and Media graduates earn S$3,350, with a middle 50% of S$3,000 to S$3,600.
- SIT Digital Communications and Integrated Media graduates earn S$3,675, with a middle 50% of S$3,400 to S$4,010.
Job outcomes for design graduates34.8% of NTU Art, Design and Media graduates were in full-time permanent jobs, against 69.4% at SIT.
34.8% of NTU Art, Design and Media graduates were in full-time permanent jobs, against 69.4% at SIT.
Share of graduates in the labour force.
| Programme | Course response rate | Currently employed | In full-time permanent employment |
|---|---|---|---|
| NTU, Art, Design and Media | 75% | 69.7% | 34.8% |
| SIT, Digital Communications and Integrated Media | 71% | 81.6% | 69.4% |
- 69.7% of the NTU graduates were employed, which includes part-time, temporary and freelance work.
How pay changes with age
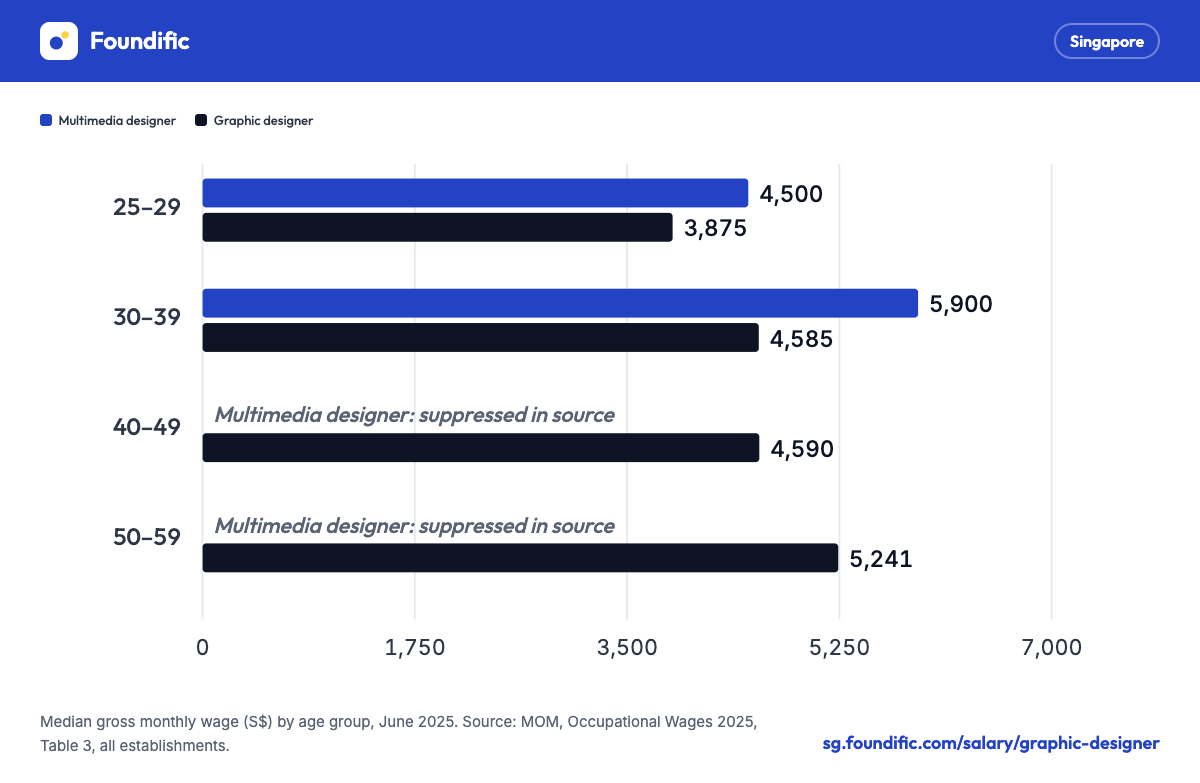
Graphic designer pay rises from S$3,875 at 25 to 29 to S$5,241 at 50 to 59. It is almost flat between 30 and 49.
Median gross monthly wage by age group.
| Occupation | 25–29 | 30–39 | 40–49 | 50–59 |
|---|---|---|---|---|
| Graphic designer | 3,875 | 4,585 | 4,590 | 5,241 |
| Multimedia designer/artist/animator | 4,500 | 5,900 | – | – |
Source cells (MOM spreadsheet)
T3!C126:K126, T3!C156:K156- From 30 to 49, the median stays at S$4,585 to S$4,590.
- Multimedia designers earn S$4,500 at 25 to 29 and S$5,900 at 30 to 39. MOM suppresses the older age bands.
- Each age band shows different people in June 2025.
By sex and employer sizeMale graphic designers earn S$4,417 at the median and women S$4,180.
Male graphic designers earn S$4,417 at the median and women S$4,180.
| Occupation | All, median gross | Men | Women | Women vs men |
|---|---|---|---|---|
| Graphic designer | 4,225 | 4,417 | 4,180 | -5.4% |
| Multimedia designer/artist/animator | 5,400 | 5,600 | 4,549 | -18.8% |
Source cells (MOM spreadsheet)
T1.1!C125:E125, T1.2!C130:E130, T1.1!C155:E155, T1.2!C158:E158| Occupation | Firms with 25 to 199 employees | Firms with 200 or more | Large vs small |
|---|---|---|---|
| Graphic designer | 3,816 | 4,888 | +28.1% |
| Multimedia designer/artist/animator | 4,300 | 6,050 | +40.7% |
Source cells (MOM spreadsheet)
T2!C144:G144, T2!C175:G175- Firms with 200 or more staff pay S$4,888, S$1,072 more than firms with 25 to 199.
- These compare two groups. They are not an adjusted pay gap.
By employer industry
Graphic designers earn most in information and communications (S$5,600) and least in accommodation and food services (S$2,188).
| Employer industry | Median gross wage | Gross wage, middle 50% |
|---|---|---|
| Information and Communications | 5,600 | 4,375 to 7,680 |
| Professional Services | 4,650 | 3,934 to 5,678 |
| Construction | 4,050 | 3,500 to 5,000 |
| Administrative and Support Services | 3,925 | 3,185 to 4,664 |
| Manufacturing | 3,913 | 2,905 to 5,303 |
| Wholesale and Retail Trade | 3,700 | 2,839 to 4,700 |
| Accommodation and Food Services | 2,188 | 1,600 to 4,000 |
Source cells (MOM spreadsheet)
T4.6!C54:I54, T4.9!C73:I73, T4.2!C37:I37, T4.10!C36:I36, T4.1!C61:I61, T4.3!C58:I58, T4.5!C29:I29- Professional services, where design and advertising firms sit, pays S$4,650.
- The gap between the highest and lowest industry median is S$3,412.
Pay over time and 2026 outlook
Graphic designer pay is projected at S$4,210 for June 2026, close to the 2025 median of S$4,225.
Official medians for the last six years, then a projection for June 2026.
| Occupation | 2020 | 2021 | 2022 | 2023 | 2024 | 2025 | Trend |
|---|---|---|---|---|---|---|---|
| Graphic designer | 3,100 | 3,318 | 3,800 | 3,859 | 3,765 | 4,225 | |
| Multimedia designer/artist/animator | – | – | – | – | – | 5,400 |
June 2026 projection Estimate
| Occupation | June 2025 (MOM) | June 2026 projection | 80% range | Range |
|---|---|---|---|---|
| Graphic designer | 4,225 | 4,210 | 3,670 to 4,830 | |
| Multimedia designer/artist/animator | 5,400 | Not projected: not enough history | ||
- This estimate is our projection, not MOM data. MOM's June 2026 figures are due around mid-2027 and will replace it.
- The median rose from S$3,100 in 2020 to S$4,225 in 2025.
- Multimedia designers have no projection, because their job code has only one year of figures.
Is graphic design affected by AI?
The ILO rates graphic and multimedia designers Moderate for exposure to generative AI. Creating images and design concepts are the most exposed tasks.
Based on the International Labour Organization's 2025 index, which scores every core task of a job from 0 (AI cannot help) to 1 (AI could do nearly all of it).
AI can speed up a fair share of the work, so the job is likely to change.
- Most exposed taskCreating two-dimensional and three-dimensional images…
- Least exposed taskNegotiating design solutions
- In numbersAI could do a large part of 6 of its 10 main tasks.
AI can speed up a fair share of the work, so the job is likely to change.
- Most exposed taskCreating two-dimensional and three-dimensional images…
- Least exposed taskNegotiating design solutions
- In numbersAI could do a large part of 6 of its 10 main tasks.
- Not exposed
- Minimal
- Some
- Moderate
- High
- Very high
Scored as ILO group 2166 Graphic and multimedia designers. Average task score 0.49, higher than 88% of the 427 jobs the ILO scored.
- Not exposed
- Minimal
- Some
- Moderate
- High
- Very high
Scored as ILO group 2166 Graphic and multimedia designers. Average task score 0.49, higher than 88% of the 427 jobs the ILO scored.
| Factor | Graphic designer | Multimedia designer/artist/animator |
|---|---|---|
| 1Exposure levelThe ILO's rating for the whole job, from not exposed up to very high. | Moderate | Moderate |
| 2Average task scoreHow much of each core task generative AI could do, averaged. 0 means none, 1 means nearly all. | 0.49 higher than 88% of jobs | 0.49 higher than 88% of jobs |
| 3Tasks AI could do much ofTasks scoring 0.5 or more. These are the parts of the job most likely to change. | 6 of 10 | 6 of 10 |
| 4Hands-on or people tasksTasks scoring under 0.25: physical, in-person or judgement work that AI barely touches. | 0 of 10 | 0 of 10 |
| 5How even the exposure isEven means AI touches most tasks a little. Uneven means a few tasks are exposed and the rest are not. | Even (0.09) | Even (0.09) |
| 6Most exposed taskWhere AI tools are likely to show up first. | Creating two-dimensional and three-dimensional images… 0.61 | Creating two-dimensional and three-dimensional images… 0.61 |
| 7Least exposed taskThe task AI can help with least. | Negotiating design solutions with clients, management… 0.37 | Negotiating design solutions with clients, management… 0.37 |
| 8Pay trend so farChange in the MOM median since the first year on record. Any AI effect would show here in later years. | +36% S$3,100 (2020) to S$4,225 (2025) | Not enough years |
- 0.61Creating two-dimensional and three-dimensional images depicting objects in…
- 0.58Formulating design concepts for the subject to be communicated
- 0.56Preparing sketches, diagrams, illustrations and layouts to communicate design…
- 0.37Negotiating design solutions with clients, management, sales and production…
- 0.38Supervising or carrying out production in the chosen media
- 0.41Determining the objectives and constraints of the design brief by consulting…
Source cells (MOM spreadsheet)
SSOC 21661 to ISCO 2166 (SSOC2024-ISCO08!B180); SSOC 21662 to ISCO 2166 (SSOC2024-ISCO08!B181)- Creating 2D and 3D images is the most exposed task, at 0.61, followed by formulating design concepts at 0.585.
- Negotiating design solutions with clients is the least exposed task, at 0.37, followed by supervising production at 0.375.
- Exposure measures how much of the work AI could do or speed up. It does not measure job cuts.
Which figure should you compare with?
Match your title first, then your age band and industry.
| You are | Compare with | Figure |
|---|---|---|
| Design graduate | NTU or SIT design course, 2025 | S$3,350 to S$3,675 |
| Graphic designer, early career | Age 25 to 29 median | S$3,875 |
| Graphic designer, 30s or 40s | Age 30 to 49 median | S$4,585 to S$4,590 |
| Designer at a tech or media firm | Information and communications figure | S$5,600 |
| Designer at an agency | Professional services figure | S$4,650 |
| Animator or multimedia designer | Multimedia designer row | S$5,400 |
About these figures
What the pay figures includeMonthly gross pay with allowances and overtime, without bonuses or employer CPF
Every figure is monthly, includes allowances and overtime, and excludes bonuses and employer CPF.
| Measure | Includes | Excludes |
|---|---|---|
| Basic wage | Basic pay | Allowances, overtime, bonus, employer CPF |
| Gross wage | Basic + allowances + overtime + commissions | Bonus, employer CPF, lump sums |
| Graduate salary | Same as gross, full-time permanent jobs only | Bonus, employer CPF |
- S$4,225 × 12 = S$50,700 a year before bonus. It is not a total package.
What this data does not coverMOM covers employees of private firms with at least 25 staff, so freelance designers and small studios are not in these figures.
MOM covers employees of private firms with at least 25 staff, so freelance designers and small studios are not in these figures.
- Self-employed designers and freelancers are not employees and are outside the survey.
- Small studios with fewer than 25 staff are outside the survey.
- Bonuses are excluded from every figure.
Questions
What is the graphic designer salary in Singapore?
MOM's median gross monthly wage for graphic designer was S$4,225 in June 2025. The middle half earned S$3,200 to S$5,500. Basic pay alone had a median of S$4,188.
What is the graphic designer salary per year in Singapore?
S$4,225 a month is S$50,700 a year before bonus. Bonuses and the employer's CPF contribution come on top and are not in MOM's monthly figure.
How does graphic designer pay change with age?
Median gross monthly pay for graphic designer was S$3,875 at 25 to 29, S$4,585 at 30 to 39, S$4,590 at 40 to 49 and S$5,241 at 50 to 59, in June 2025.
What is the starting salary for design graduates?
Graduates of the related degrees had median gross starting pay of S$3,350 to S$3,675 a month in MOE's 2025 survey. The highest was SIT, Digital Communications and Integrated Media.
Which industry pays graphic designer jobs the most?
Information and Communications, with a median of S$5,600 a month. The lowest published median is in accommodation and food services, at S$2,188.
What is the difference between a graphic designer and a multimedia designer?
Graphic designer conceptualises, develops and refines design solutions according to design briefs. Multimedia designer/artist/animator conceptualises, develops and refines creative communication by utilising computer technologies to create special effects, animation and live video content for a diverse array of media (e.g. In June 2025 the median gross monthly wage was S$4,225 for graphic designers and S$5,400 for multimedia designers (MOM; definitions from SSOC 2024).
Where do these figures come from?
From MOM's Occupational Wages 2025, which covers full-time resident employees in private firms with at least 25 staff, as at June 2025. Gross wages include allowances and overtime but not bonuses or employer CPF.
Related guides
Sources
MOM Occupational Wages 2025 and MOE Graduate Employment Survey 2025
- MOM, Occupational Wages 2025, Tables 1 to 4. June 2025, released 30 June 2026. SSOC 21661, 21662. Exact cells are listed under each table.
- MOE, NTU GES 2025. Art, Design and Media.
- MOE, SIT GES 2025. Bachelor of Science with Honours in Digital Communications and Integrated Media.
- MOM, Coverage and Methodology 2025.
- ILO generative AI exposure index 2025, matched to SSOC through the SingStat correspondence table.