Chef salary in Singapore
What the job is: Chef (excluding pastry chef) oversees all the production of food served at the restaurant, banquet functions, and other outlets. Also called: Executive chef, Chef de cuisine, Assistant head chef. SSOC 2024, 34341
- Chef: S$3,650 median a month. Middle 50% earn S$2,743 to S$4,784.
- Pastry chef: S$3,436 median.
- Senior cook: S$2,515 median. Cook: S$1,897 median.
- Kitchen operations head or supervisor: S$4,517 median.
- By employer size: chefs earn S$3,952 at employers with 200 or more staff and S$3,100 at 25 to 199.
How much do chefs earn?
A chef earns S$3,650 at the median. Senior cooks earn S$2,515 and cooks S$1,897.
Gross monthly wage, June 2025, all industries.
| Occupation, all industries | Basic wage, median | Gross, 25th percentile | Gross, median | Gross, 75th percentile |
|---|---|---|---|---|
| Kitchen operations head/supervisorPartial detail | 4,387 | 3,116 | 4,517 | 5,781 |
| Chef (excluding pastry chef)Full detail | 3,460 | 2,743 | 3,650 | 4,784 |
| Pastry chefPartial detail | 3,240 | 2,665 | 3,436 | 5,305 |
| Senior cookPartial detail | 2,400 | 1,664 | 2,515 | 3,495 |
| CookFull detail | 1,792 | 1,600 | 1,897 | 3,000 |
Source cells (MOM spreadsheet)
T4!C291:I291, T4!C262:I262, T4!C319:I319, T4!C426:I426, T4!C403:I403- Chefs have a range of S$2,041 between the 25th and 75th percentile.
- The chef basic median is S$3,460.
- A chef oversees food production, develops recipes and menus, and supervises cooks (SSOC 2024).
- A senior cook supervises one or more kitchen sections, such as pastry, sauces or vegetables (SSOC 2024).
What affects pay most
For Chef (excluding pastry chef) (SSOC 34341), industry makes the largest difference: S$4,501 (Professional Services) against S$2,478 (Manufacturing), 82% more.
| What changes | Lowest | Median | Highest | Median | Highest vs lowest |
|---|---|---|---|---|---|
| Industry | Manufacturing | 2,478 | Professional Services | 4,501 | 82% |
| Age | 25 to 29 | 3,181 | 40 to 49 | 4,128 | 30% |
| Sex | Women | 3,028 | Men | 3,880 | 28% |
| Firm size | 25 to 199 staff | 3,100 | 200 or more staff | 3,952 | 27% |
How pay changes with age
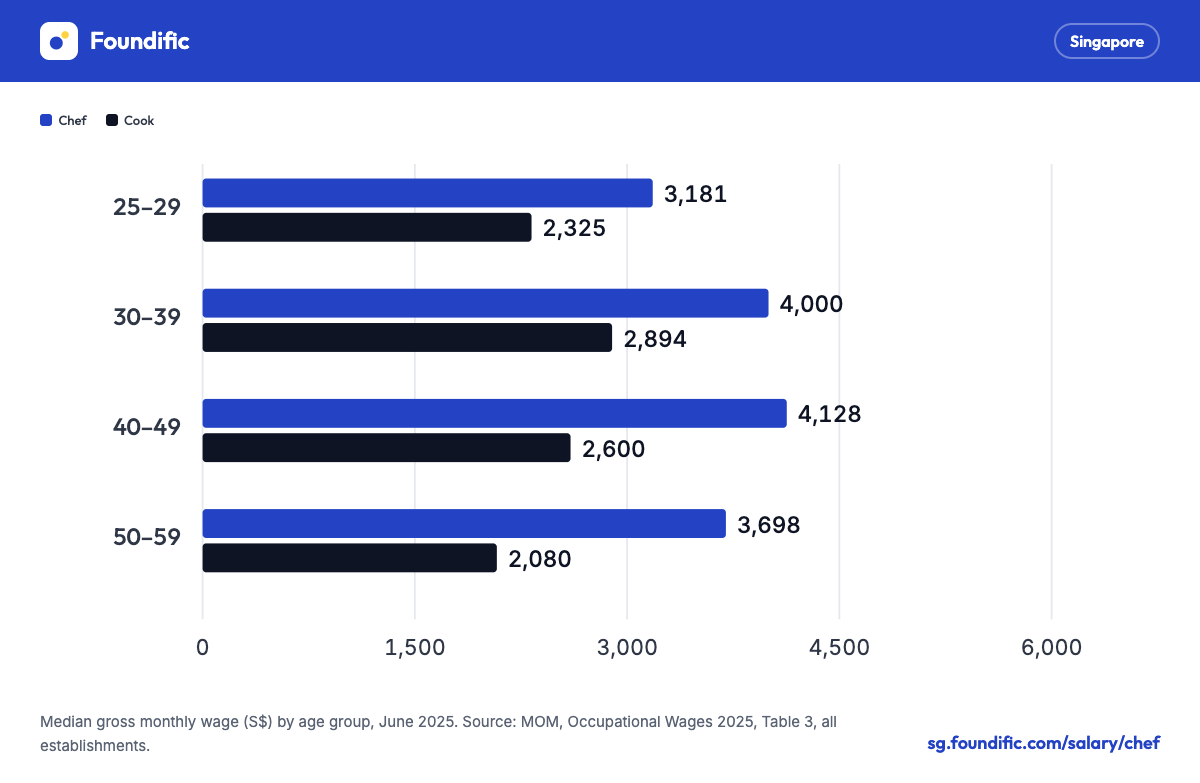
Chef pay rises from S$3,181 at 25 to 29 to S$4,000 at 30 to 39 and S$4,128 at 40 to 49.
Median gross monthly wage by age group.
| Occupation | 25–29 | 30–39 | 40–49 | 50–59 |
|---|---|---|---|---|
| Chef (excluding pastry chef) | 3,181 | 4,000 | 4,128 | 3,698 |
| Pastry chef | – | 3,977 | – | – |
| Kitchen operations head/supervisor | – | 4,680 | 5,238 | 4,556 |
| Senior cook | – | 3,042 | 2,832 | 2,594 |
| Cook | 2,325 | 2,894 | 2,600 | 2,080 |
Source cells (MOM spreadsheet)
T3!C221:K221, T3!C270:K270, T3!C247:K247, T3!C361:K361, T3!C344:K344- Chefs aged 50 to 59 earn S$3,698.
- Cooks earn S$2,325 at 25 to 29 and S$2,894 at 30 to 39.
- Each age band shows different people in June 2025.
By sex and employer sizeMale chefs earn S$3,880 at the median and women S$3,028.
Male chefs earn S$3,880 at the median and women S$3,028.
| Occupation | All, median gross | Men | Women | Women vs men |
|---|---|---|---|---|
| Chef (excluding pastry chef) | 3,650 | 3,880 | 3,028 | -22.0% |
| Pastry chef | 3,436 | 3,676 | 3,193 | -13.1% |
| Kitchen operations head/supervisor | 4,517 | 4,631 | 3,664 | -20.9% |
| Senior cook | 2,515 | 2,939 | 2,278 | -22.5% |
| Cook | 1,897 | 1,754 | 2,015 | +14.9% |
Source cells (MOM spreadsheet)
T1.1!C227:E227, T1.2!C223:E223, T1.1!C280:E280, T1.2!C266:E266, T1.1!C254:E254, T1.2!C245:E245, T1.1!C371:E371, T1.2!C360:E360, T1.1!C353:E353, T1.2!C344:E344| Occupation | Firms with 25 to 199 employees | Firms with 200 or more | Large vs small |
|---|---|---|---|
| Chef (excluding pastry chef) | 3,100 | 3,952 | +27.5% |
| Pastry chef | 3,200 | 3,925 | +22.7% |
| Kitchen operations head/supervisor | 2,334 | 5,397 | +131.2% |
| Senior cook | 2,048 | 3,030 | +47.9% |
| Cook | 1,600 | 2,800 | +75.0% |
Source cells (MOM spreadsheet)
T2!C254:G254, T2!C310:G310, T2!C282:G282, T2!C412:G412, T2!C391:G391- Chefs earn S$3,952 at employers with 200 or more staff and S$3,100 at 25 to 199.
- Cooks earn S$2,800 at employers with 200 or more staff and S$1,600 at 25 to 199.
- Female cooks earn S$2,015 at the median and men S$1,754.
- These compare two groups. They are not an adjusted pay gap.
By employer industry
Chefs in professional services earn S$4,501 at the median. In accommodation and food services the median is S$3,600.
| Employer industry | Median gross wage | Gross wage, middle 50% |
|---|---|---|
| Professional Services | 4,501 | 3,000 to 5,512 |
| Health and Social Services | 4,200 | 3,142 to 4,972 |
| Real Estate Services | 4,140 | 3,654 to 4,532 |
| Accommodation and Food Services | 3,600 | 2,714 to 4,800 |
| Administrative and Support Services | 3,338 | 2,781 to 3,900 |
| Wholesale and Retail Trade | 2,983 | 2,530 to 4,200 |
| Arts, Entertainment and Recreation | 2,820 | 1,600 to 4,443 |
| Manufacturing | 2,478 | 1,600 to 4,100 |
Source cells (MOM spreadsheet)
T4.9!C117:I117, T4.12!C57:I57, T4.8!C35:I35, T4.5!C34:I34, T4.10!C46:I46, T4.3!C92:I92, T4.13!C31:I31, T4.1!C108:I108- In accommodation and food services, the middle 50% of chefs earn S$2,714 to S$4,800.
- The lowest published median for chefs is in manufacturing, at S$2,478.
Pay over time
The chef median was S$3,250 in 2020, peaked at S$4,100 in 2023 and was S$3,650 in 2025.
Official medians for the last six years, then a projection for June 2026.
| Occupation | 2020 | 2021 | 2022 | 2023 | 2024 | 2025 | Trend |
|---|---|---|---|---|---|---|---|
| Chef (excluding pastry chef) | 3,250 | 3,601 | 3,900 | 4,100 | 3,850 | 3,650 | |
| Pastry chef | 3,300 | – | 3,200 | 4,200 | 3,034 | 3,436 | |
| Kitchen operations head/supervisor | 2,600 | – | 4,471 | 3,959 | 3,949 | 4,517 | |
| Senior cook | 2,575 | 2,711 | 2,750 | 3,090 | 3,425 | 2,515 | |
| Cook | 1,800 | 1,700 | 2,168 | 2,397 | 2,028 | 1,897 |
| Occupation | June 2025 (MOM) | June 2026 projection | 80% range | Range |
|---|---|---|---|---|
| Chef (excluding pastry chef) | 3,650 | 3,960 | 3,440 to 4,570 |
- Foundific's projection for June 2026 is S$3,960, with an 80% range of S$3,440 to S$4,570. It is a projection, not official data.
- The other kitchen jobs are not projected because their medians move too much from year to year.
Is cooking work affected by AI?
The ILO rates chefs and cooks Not exposed to generative AI.
Based on the International Labour Organization's 2025 index, which scores every core task of a job from 0 (AI cannot help) to 1 (AI could do nearly all of it).
AI can do very little of this job. Most tasks are hands-on or face to face.
- Most exposed taskPlanning and developing recipes and menus
- Least exposed taskPreparing, seasoning and cooking speciality foods
- In numbersNone of its 10 main tasks is one AI could do a large part of.
AI can do very little of this job. Most tasks are hands-on or face to face.
- Most exposed taskPlanning, supervising and coordinating the work of kitchen…
- Least exposed taskOperating large-volume cooking equipment
- In numbersNone of its 7 main tasks is one AI could do a large part of.
- Not exposed
- Minimal
- Some
- Moderate
- High
- Very high
Scored as ILO group 3434 Chefs. Average task score 0.25, higher than 47% of the 427 jobs the ILO scored.
- Not exposed
- Minimal
- Some
- Moderate
- High
- Very high
Scored as ILO group 5120 Cooks. Average task score 0.18, higher than 29% of the 427 jobs the ILO scored.
| Factor | Chef (excluding pastry chef) | Cook |
|---|---|---|
| 1Exposure levelThe ILO's rating for the whole job, from not exposed up to very high. | Not exposed | Not exposed |
| 2Average task scoreHow much of each core task generative AI could do, averaged. 0 means none, 1 means nearly all. | 0.25 higher than 47% of jobs | 0.18 higher than 29% of jobs |
| 3Tasks AI could do much ofTasks scoring 0.5 or more. These are the parts of the job most likely to change. | 0 of 10 | 0 of 7 |
| 4Hands-on or people tasksTasks scoring under 0.25: physical, in-person or judgement work that AI barely touches. | 5 of 10 | 5 of 7 |
| 5How even the exposure isEven means AI touches most tasks a little. Uneven means a few tasks are exposed and the rest are not. | Even (0.06) | Even (0.06) |
| 6Most exposed taskWhere AI tools are likely to show up first. | Planning and developing recipes and menus, estimating food… 0.38 | Planning, supervising and coordinating the work of kitchen… 0.29 |
| 7Least exposed taskThe task AI can help with least. | Preparing, seasoning and cooking speciality foods and… 0.16 | Operating large-volume cooking equipment such as grills… 0.10 |
| 8Pay trend so farChange in the MOM median since the first year on record. Any AI effect would show here in later years. | +12% S$3,250 (2020) to S$3,650 (2025) | +5% S$1,800 (2020) to S$1,897 (2025) |
- 0.38Planning and developing recipes and menus, estimating food and labour costs…
- 0.28Discussing food preparation issues with managers, dieticians, kitchen and…
- 0.27Participating on the recruitment of kitchen staff and monitoring their…
- 0.16Preparing, seasoning and cooking speciality foods and complex dishes
- 0.18Monitoring quality of dishes at all stages of preparation and presentation
- 0.22Determining how food should be presented, and creating decorative food…
- 0.29Planning, supervising and coordinating the work of kitchen helpers
- 0.25Regulating the temperature of ovens, grills, roasters and other cooking…
- 0.19Planning meals, preparing and cooking foodstuffs
- 0.10Operating large-volume cooking equipment such as grills, deep-fat fryers or…
- 0.14Weighing, measuring and mixing ingredients according to recipes and personal…
- 0.15Inspecting and cleaning the kitchen, kitchen equipment and serving areas, to…
Source cells (MOM spreadsheet)
SSOC 34341 to ISCO 3434 (SSOC2024-ISCO08!B612); SSOC 51201 to ISCO 5120 (SSOC2024-ISCO08!B725)- For chefs, planning recipes and menus, estimating costs and ordering supplies is the most exposed task, at 0.38.
- Preparing, seasoning and cooking speciality foods is the least exposed chef task, at 0.16.
- For cooks, the most exposed task is planning and supervising the work of kitchen helpers, at 0.29.
- Exposure measures how much of the work AI could do or speed up. It does not measure job cuts.
Which figure should you compare with?
Match your title first, then your age band and the size of your employer.
| You are | Compare with | Figure |
|---|---|---|
| Cook | Cook row, all ages | S$1,897 |
| Senior cook | Chef de partie, line cook, demi chef | S$2,515 |
| Chef, early career | Age 25 to 29 median | S$3,181 |
| Chef, age 30 to 49 | Age 30 to 49 | S$4,000 to S$4,128 |
| Chef at a large employer | 200 or more staff | S$3,952 |
| Kitchen operations head | Central kitchen head or supervisor | S$4,517 |
About these figures
What the pay figures includeMonthly gross pay with allowances and overtime, without bonuses or employer CPF
Every figure is monthly, includes allowances and overtime, and excludes bonuses and employer CPF.
| Measure | Includes | Excludes |
|---|---|---|
| Basic wage | Basic pay | Allowances, overtime, bonus, employer CPF |
| Gross wage | Basic + allowances + overtime + commissions | Bonus, employer CPF, lump sums |
| Graduate salary | Same as gross, full-time permanent jobs only | Bonus, employer CPF |
- S$3,650 × 12 = S$43,800 a year before bonus. It is not a total package.
What this data does not coverMOM surveys private-sector employers with at least 25 staff, so small restaurants are not covered.
MOM surveys private-sector employers with at least 25 staff, so small restaurants are not covered.
- Every MOM figure is for full-time resident employees.
- MOM figures exclude bonuses.
Questions
What is the chef salary in Singapore?
MOM's median gross monthly wage for chef was S$3,650 in June 2025. The middle half earned S$2,743 to S$4,784. Basic pay alone had a median of S$3,460.
What is the chef salary per year in Singapore?
S$3,650 a month is S$43,800 a year before bonus. Bonuses and the employer's CPF contribution come on top and are not in MOM's monthly figure.
How does chef pay change with age?
Median gross monthly pay for chef was S$3,181 at 25 to 29, S$4,000 at 30 to 39, S$4,128 at 40 to 49 and S$3,698 at 50 to 59, in June 2025.
Which industry pays chef jobs the most?
Professional Services, with a median of S$4,501 a month. The lowest published median is in manufacturing, at S$2,478.
Which of these jobs pay the most?
Kitchen operations head/supervisor has the highest median, S$4,517 a month, and cook the lowest, S$1,897 (MOM, June 2025).
What is the difference between a chef and a senior cook?
Chef (excluding pastry chef) oversees all the production of food served at the restaurant, banquet functions, and other outlets. Senior cook directly supervises and coordinates activities of workers engaged in preparing and serving food. In June 2025 the median gross monthly wage was S$3,650 for chefs and S$2,515 for senior cooks (MOM; definitions from SSOC 2024).
Where do these figures come from?
From MOM's Occupational Wages 2025, which covers full-time resident employees in private firms with at least 25 staff, as at June 2025. Gross wages include allowances and overtime but not bonuses or employer CPF.
Related guides
Sources
MOM Occupational Wages 2025
- MOM, Occupational Wages 2025, Tables 1 to 4. June 2025, released 30 June 2026. SSOC 34341, 34343, 34342, 51202, 51201. Exact cells are listed under each table.
- MOM, Coverage and Methodology 2025.
- ILO generative AI exposure index 2025, matched to SSOC through the SingStat correspondence table.