Actuary salary in Singapore
What the job is: Actuary deals with statistical, mathematical and financial calculations mainly involving the probability of future payments or contingencies in pension or insurance plans. Also called: Insurance actuary, Actuarial consultant. SSOC 2024, 21213
- Actuary: S$7,953 median a month. Middle 50% earn S$5,433 to S$11,616.
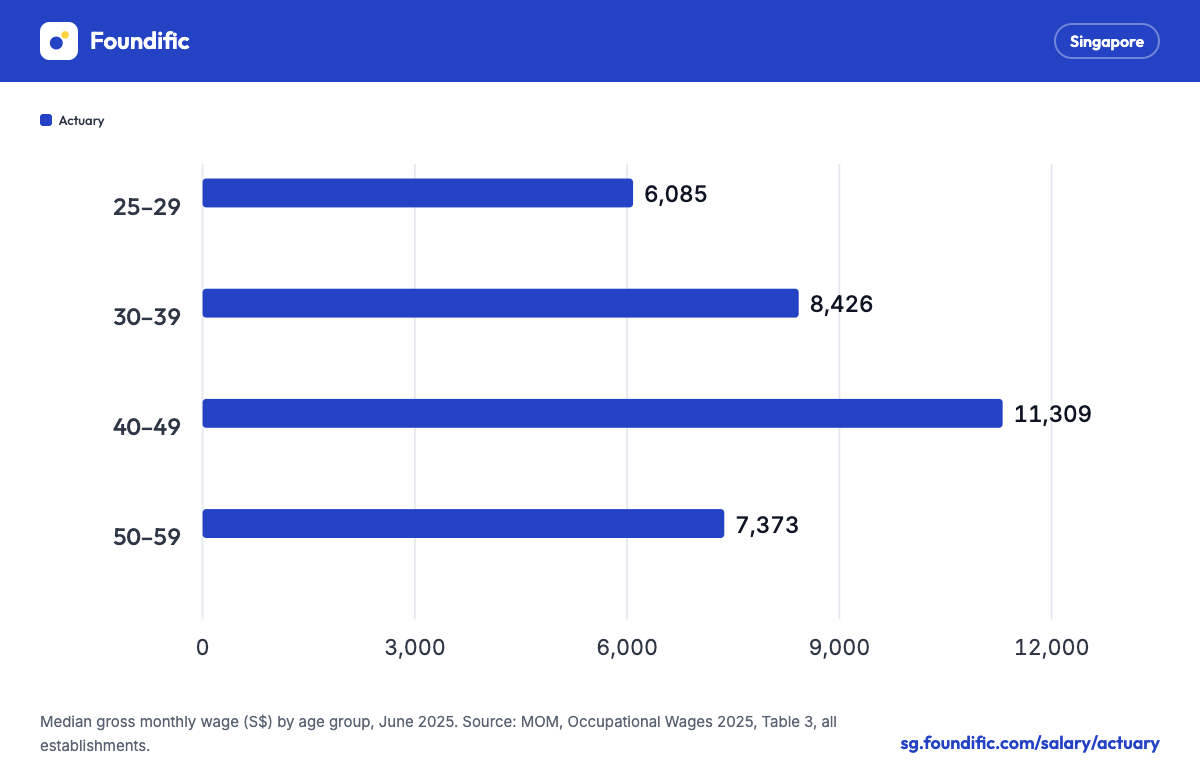
- By age: S$6,085 at 25 to 29, S$8,426 at 30 to 39, S$11,309 at 40 to 49 and S$7,373 at 50 to 59.
- In financial and insurance services: S$7,464 median.
- By sex: men earn S$9,260 at the median and women S$6,738.
- AI exposure: the ILO rates actuaries High.
How much do actuaries earn?
An actuary earns S$7,953 at the median. The middle 50% earn S$5,433 to S$11,616.
Gross monthly wage, June 2025, all industries.
| Occupation, all industries | Basic wage, median | Gross, 25th percentile | Gross, median | Gross, 75th percentile |
|---|---|---|---|---|
| ActuaryFull detail | 7,814 | 5,433 | 7,953 | 11,616 |
Source cells (MOM spreadsheet)
T4!C73:I73- Actuaries have a range of S$6,183 between the 25th and 75th percentile.
- The basic median is S$7,814.
- An actuary calculates the probability of future payments in pension or insurance plans, evaluates risk and calculates premium rates (SSOC 2024).
What affects pay most
For Actuary (SSOC 21213), age makes the largest difference: S$11,309 (40 to 49) against S$6,085 (25 to 29), 86% more.
| What changes | Lowest | Median | Highest | Median | Highest vs lowest |
|---|---|---|---|---|---|
| Age | 25 to 29 | 6,085 | 40 to 49 | 11,309 | 86% |
| Firm size | 200 or more staff | 7,334 | 25 to 199 staff | 11,783 | 61% |
| Sex | Women | 6,738 | Men | 9,260 | 37% |
How pay changes with age
Actuary pay rises from S$6,085 at 25 to 29 to S$11,309 at 40 to 49. It is S$7,373 at 50 to 59.
Median gross monthly wage by age group.
| Occupation | 25–29 | 30–39 | 40–49 | 50–59 |
|---|---|---|---|---|
| Actuary | 6,085 | 8,426 | 11,309 | 7,373 |
Source cells (MOM spreadsheet)
T3!C69:K69- The median rises 38.5% from the late twenties to the thirties, then 34.2% from the thirties to the forties.
- The 50 to 59 median is S$3,936 below the 40 to 49 median.
- Age figures are MOM's June 2025 medians by age band.
By sex and employer sizeMale actuaries earn S$9,260 at the median and female actuaries S$6,738.
Male actuaries earn S$9,260 at the median and female actuaries S$6,738.
| Occupation | All, median gross | Men | Women | Women vs men |
|---|---|---|---|---|
| Actuary | 7,953 | 9,260 | 6,738 | -27.2% |
Source cells (MOM spreadsheet)
T1.1!C68:E68, T1.2!C69:E69| Occupation | Firms with 25 to 199 employees | Firms with 200 or more | Large vs small |
|---|---|---|---|
| Actuary | 11,783 | 7,334 | -37.8% |
Source cells (MOM spreadsheet)
T2!C74:G74- Employers with 25 to 199 staff pay a median of S$11,783 and employers with 200 or more staff S$7,334.
- These compare groups. They are not an adjusted pay gap.
By employer industry
In its main industry table, MOM lists an actuary median for one industry: financial and insurance services, at S$7,464.
| Employer industry | Median gross wage | Gross wage, middle 50% |
|---|---|---|
| Financial and Insurance Services | 7,464 | 5,222 to 10,983 |
Source cells (MOM spreadsheet)
T4.7!C44:I44- The middle 50% of actuaries in financial and insurance services earn S$5,222 to S$10,983.
Pay over time and 2026 outlook
The actuary median rose 26.0% from S$6,313 in 2020 to S$7,953 in 2025. It has moved too much from year to year to project.
Official medians for the last six years, then a projection for June 2026.
| Occupation | 2020 | 2021 | 2022 | 2023 | 2024 | 2025 | Trend |
|---|---|---|---|---|---|---|---|
| Actuary | 6,313 | 6,642 | – | 8,620 | 7,572 | 7,953 |
June 2026 projection Estimate
| Occupation | June 2025 (MOM) | June 2026 projection | 80% range | Range |
|---|---|---|---|---|
| Actuary | 7,953 | Not projected: too volatile | ||
- The median was S$6,642 in 2021, S$8,620 in 2023 and S$7,572 in 2024. Our linked series has no figure for 2022.
- We show no 2026 projection.
Is actuarial work affected by AI?
The ILO rates actuaries High for exposure to generative AI, with an average task score of 0.56. 9 of their 10 main tasks score 0.5 or higher.
Based on the International Labour Organization's 2025 index, which scores every core task of a job from 0 (AI cannot help) to 1 (AI could do nearly all of it).
AI can do a large part of many tasks, so the job is likely to change noticeably.
- Most exposed taskPlanning and organizing surveys and other statistical…
- Least exposed taskSupervising the work of mathematical, actuarial
- In numbersAI could do a large part of 9 of its 10 main tasks.
- Not exposed
- Minimal
- Some
- Moderate
- High
- Very high
Scored as ILO group 2120 Mathematicians, actuaries and statisticians. Average task score 0.56, higher than 94% of the 427 jobs the ILO scored.
| Factor | Actuary |
|---|---|
| 1Exposure levelThe ILO's rating for the whole job, from not exposed up to very high. | High |
| 2Average task scoreHow much of each core task generative AI could do, averaged. 0 means none, 1 means nearly all. | 0.56 higher than 94% of jobs |
| 3Tasks AI could do much ofTasks scoring 0.5 or more. These are the parts of the job most likely to change. | 9 of 10 |
| 4Hands-on or people tasksTasks scoring under 0.25: physical, in-person or judgement work that AI barely touches. | 0 of 10 |
| 5How even the exposure isEven means AI touches most tasks a little. Uneven means a few tasks are exposed and the rest are not. | Even (0.08) |
| 6Most exposed taskWhere AI tools are likely to show up first. | Planning and organizing surveys and other statistical… 0.67 |
| 7Least exposed taskThe task AI can help with least. | Supervising the work of mathematical, actuarial and… 0.35 |
| 8Pay trend so farChange in the MOM median since the first year on record. Any AI effect would show here in later years. | +26% S$6,313 (2020) to S$7,953 (2025) |
- 0.67Planning and organizing surveys and other statistical collections, and…
- 0.63Designing and putting into operation pension schemes and life, health, social…
- 0.63Evaluating, processing, analysing, and interpreting statistical data and…
- 0.35Supervising the work of mathematical, actuarial and statistical assistants…
- 0.53Preparing scientific papers and reports
- 0.54Studying, improving and developing mathematical, actuarial and statistical…
Source cells (MOM spreadsheet)
SSOC 21213 to ISCO 2120 (SSOC2024-ISCO08!B102)- Planning and organising surveys and other statistical collections is the most exposed task, at 0.67.
- Designing and putting into operation pension schemes and insurance plans scores 0.63.
- Supervising the work of mathematical, actuarial and statistical assistants is the least exposed task, at 0.35.
- The ILO scored actuaries in its group for mathematicians, actuaries and statisticians.
- Exposure measures how much of the work AI could do or speed up. It does not measure job cuts.
Which figure should you compare with?
Match your age band first, then whether your employer has 25 to 199 staff or 200 or more.
| You are | Compare with | Figure |
|---|---|---|
| Actuary, early career | Age 25 to 29 median | S$6,085 |
| Actuary in financial and insurance services | Industry median | S$7,464 |
| Actuary, all ages | All-industry median | S$7,953 |
| Actuary, thirties | Age 30 to 39 median | S$8,426 |
| Actuary, forties | Age 40 to 49 median | S$11,309 |
| Actuary at a firm with 25 to 199 staff | Size median | S$11,783 |
About these figures
What the pay figures includeMonthly gross pay with allowances and overtime, without bonuses or employer CPF
Every figure is monthly, includes allowances and overtime, and excludes bonuses and employer CPF.
| Measure | Includes | Excludes |
|---|---|---|
| Basic wage | Basic pay | Allowances, overtime, bonus, employer CPF |
| Gross wage | Basic + allowances + overtime + commissions | Bonus, employer CPF, lump sums |
| Graduate salary | Same as gross, full-time permanent jobs only | Bonus, employer CPF |
- S$7,953 × 12 = S$95,436 a year before bonus. It is not a total package.
What this data does not coverMOM surveys private-sector employers with 25 or more staff and publishes one actuary title.
MOM surveys private-sector employers with 25 or more staff and publishes one actuary title.
- Every MOM figure is for full-time resident employees.
- MOM's main industry table lists an actuary figure only for financial and insurance services.
- Small employers with fewer than 25 staff are outside the survey.
- MOM figures exclude bonuses.
Questions
What is the actuary salary in Singapore?
MOM's median gross monthly wage for actuary was S$7,953 in June 2025. The middle half earned S$5,433 to S$11,616. Basic pay alone had a median of S$7,814.
What is the actuary salary per year in Singapore?
S$7,953 a month is S$95,436 a year before bonus. Bonuses and the employer's CPF contribution come on top and are not in MOM's monthly figure.
How does actuary pay change with age?
Median gross monthly pay for actuary was S$6,085 at 25 to 29, S$8,426 at 30 to 39, S$11,309 at 40 to 49 and S$7,373 at 50 to 59, in June 2025.
What is the difference between an actuary and a statistician?
Actuary deals with statistical, mathematical and financial calculations mainly involving the probability of future payments or contingencies in pension or insurance plans. Statistician conducts research and improves or develops statistical concepts, theories and methods. In June 2025 the median gross monthly wage was S$7,953 for actuaries and S$7,723 for statisticians (MOM; definitions from SSOC 2024).
Where do these figures come from?
From MOM's Occupational Wages 2025, which covers full-time resident employees in private firms with at least 25 staff, as at June 2025. Gross wages include allowances and overtime but not bonuses or employer CPF.
Related guides
Sources
MOM Occupational Wages 2025
- MOM, Occupational Wages 2025, Tables 1 to 4. June 2025, released 30 June 2026. SSOC 21213. Exact cells are listed under each table.
- MOM, Coverage and Methodology 2025.
- ILO generative AI exposure index 2025, matched to SSOC through the SingStat correspondence table.